
Updated 7/5/2026
Getting error messages when you use free statistical software for Macs? See our “signing page.”
JASP, Jamovi, and PSPP are the free Swiss Army knives of Mac statistics software. They are all faster than SPSS, and import and export SPSS data and syntax files.
PSPP was first, but development has been slowest, and it is rather behind the others now. JASP was forked from Jamovi, but both are still under active development. They are interfaces for the well proven R software.
See a comparison of the three SPSS competitors
All three major SPSS replacements have some oddities as well as major strengths, and notably all produce the same numbers when we test them.
Listing updated 4/16/26; last Homebrew update, March 2026
The Homebrew version is at 2.11 while the binary is at 2.01-2.
Download size: quite small! Source available.
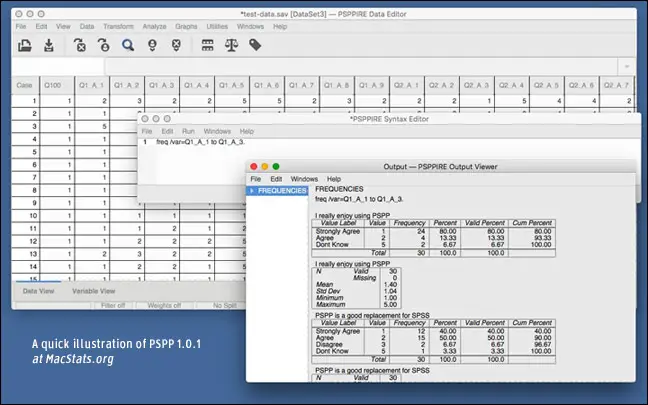
PSPP is a free SPSS clone with a Mac version you can download from this site (it’s signed and notarized). You can also build from source with HomeBrew or MacPorts. It is small and loads quickly, but has bugs on Macs and Windows—it prefers Linux. Development is slow but it does move forward. Here’s a video on installing it.
PSPP’s interface is taken from older versions of SPSS, but it doesn’t use the Mac open/save box, which makes Dropbox, iCloud, etc. harder to use. PSPP imports SPSS data files, with long variable names and variable and value labels. As you run analyses, it appends them to the output window, instead of overwriting them if you change things. This can be very handy for comparisons.
Our getting-started guide for SPSS is also helpful for getting started with PSPP.
The program is impressive, including its graphing. The routines are well fleshed out. The user interface is awkward, but it’s fast.
You can copy from the output window, but only plain-text, delimited by spaces and pipes. Regression does not allow for multiple step entry or forward, backward, or stepwise models. SPSS has changed their output file format, killing PSPP’s ability to open them.
PSPP is easy to build and update via Homebrew and MacPorts, as well as installing the binary. If you've installed via Homebrew, you can upgrade it by typing brew update in the Terminal, then brew upgrade when Update is done. Get the GUI version of the program from the command line by typing psppire at the Terminal prompt. If you install the binary instead, it acts like any other Mac program.
Bugs and problems (last updated 4-16-2026).
Listing updated: 5/18/2026
Version: 0.97.0
1.4 GB download, 2.2GB on disk!
JASP, created by people at the University of Amsterdam, is fast and easy to use. It has a Mac-native open/save dialogue box (after you click Browse in their menu), and supports value and variable labels and longer description fields. It imports from SPSS and Stata, along with spreadsheets; and even has Minitab workbook support. Since so much data is sensitive, JASP now supports file encryption—and it has a CSV previewer for important. Recent developments have sped importing of large files.
JASP feels as native as SPSS, but is far faster. Its Bayesian statistics may confuse some new people. Stepwise, forward, backward, and manual (“enter”) regression are all supported, which is almost unique among free software though part of SPSS and Stata. MNLFA and other SEM analysis is also included.
You can assign value labels variable by variable only, without syntax, and variable labels are not consistently shown in output. Computing new variables is relatively easy now, but if you really want to make that (or recoding) easier, or if you want to figure out a way to add variable or value labels more easily, you can unzip the jasp file, then use sqlite (or phpLiteAdmin*) to make changes or move columns into a spreadsheet such as Libre/Open Office Calc or Excel. Doing the following from Terminal will provide a pipe-separated text file:
unzip yourfile.jasp
sqlite3 internal.sqlite "select name,title from columns;" > columns.txt
* See instructions for using a local copy of phpLiteAdmin
Developers are very responsive. It took around two months for developers to confirm and resolve issues with large file handling, fixing bugs which were not their fault—a fast response given all that they needed to do.
The interface for recoding data is arcane, but one can also change the data in a spreadsheet program and reimport it easily.* New columns (variables) can be created by inserting a blank column, then copy-pasting. That won’t move labels and custom missing values over, though. (Missing values can be defined program-wide or by variable, quite easily.)
* In testing we had a “partly user error” issue—we’d defined the native program as Excel but were trying to use imported SPSS files, so JASP was trying to open SPSS files in Excel. It is not really obvious but synchronization will try to open whatever file format you had, so if you imported from SPSS (.sav format), it will try to edit in SPSS (.sav format). This kind of rules out synchronization if you want to keep it in SPSS format and don’t have SPSS.

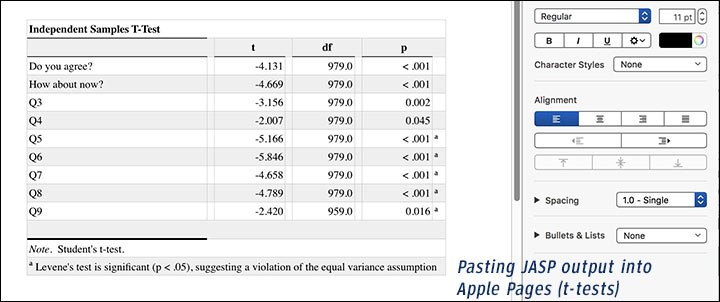
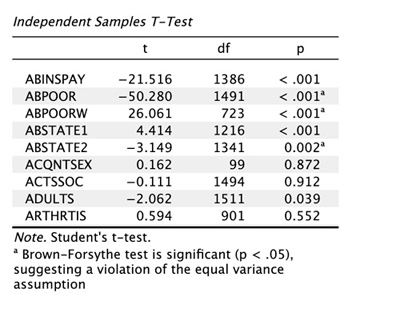
When you do t-tests, if equal variances are not present, it prints out a warning, and you must switch to Welch’s t-test (a version of the classic Student’s t-test); it does not apply Welch’s t-test automatically, not that any program we’ve looked at does this. The format for multiple t-tests is quite neat, though. (It has recently made this clearer in the output.)
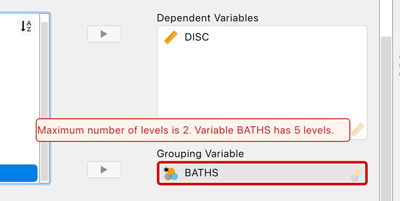
t-tests require two-value group variables—you can't pick, say, Dodge vs Chrysler from a list of automotive brands; you have to create a new variable consisting solely of Dodge and Chrysler, which is a nuisance given the new-variable computing interface. Variable lists don't show labels, so variable names have to be chosen carefully.
You can set the resolution of charts, so you can copy them at 300 dpi if you want.
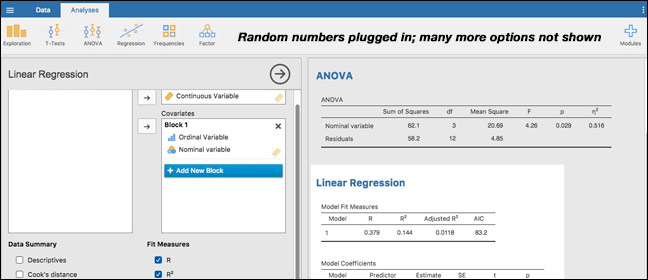
JASP’s advantages over Jamovi include supporting forward, backward, and stepwise regression, while Jamovi only supports "Enter.” JASP has niftier menus and nicer output; an integrated R syntax plugin; and Bayesian statistics everywhere. Jamovi does have its own advantages...see below... one of which is not having Bayesian statistics everywhere, if you’re not using them.
There is a great deal of documentation in the newish book Learning Statistics with JASP. There is also a Machine Learning module, predictive statistics, and visual modeling.
In our run-throughs, the numbers were identical to SPSS, PSPP, and Jamovi.
Dive more deeply into JASP (full MacStats review). Also see this video on using JASP to do a t-test and contingency tables when using a grouping variable with nine values... as an alternative to creating a new variable with just two.
Listing updated: 7/5/2026; updates are roughly once a month (last update 7/1)
See the an online “cloud” version
Signed by Apple
378MB download, 800MB in place
Jamovi: A free, open source package, built atop R (Thanks, Dr. Kim-Oliver Tietze). Jamovi uses a spreadsheet interface with full graphics, and allows both syntax and menus. You can edit via spreadsheet or internally; and your data, analyses, and options are saved in a single file, so others can reproduce your work. A large number of analyses are easy to find.
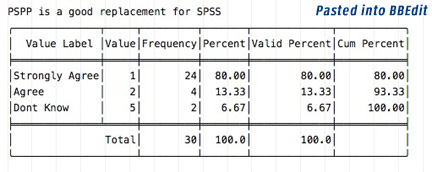
The results are attractive (see above), with menus that will be familiar to any SPSS users and with many options. Copying and pasting output is cleverly done; right-click on a section of output, and you can paste it into Word as a nicely formatted table. Paste into BBEdit, and it will be plain-text, formatted with spaces. There are three built in plot themes.
The online (cloud) version is responsive and free.
Syntax mode shows the R syntax for each menu command, helping you to learn it or to make scripts to reproduce the same actions over and over, ... except for importing data. Data can be imported in numerous ways, including SPSS, SAS, and Stata files. It supports variable labels but not value labels at all. In the past, not checked recently, export from Jamovi to SPSS resulted in errors on some data files as the number of characters in some fields was not correctly marked. You can export into Excel, too.
Shortcomings. Jamovi is very fast, but (like PSPP) doesn’t fully use the Mac interface. If you click on "Browse" in the file open/close menu, you get access to the native file selection system.
Jamovi’s menus are kept within its own window instead of at the top of the screen, and the open/save dialogue box is quite different, though it does show shortcuts for the documents, downloads, desktop, and home folders, and you can click Browse to get the standard interface.
Variable names have to be cleaned before importing data, because the variable lists work in alphabetical order and don't show labels.
You only get Enter for linear regression. You can however do multiple blocks which is at least better than PSPP if not up to JASP. Regression allows easy entry of factors and weights, but some of the options (e.g. the two methods of intercept plotting) will require some research.
If you do a student’s t-test on groups with different variances, it prints a warning rather than using the alternate formula; at this point you must to switch to Welch’s test (it would be nice if descriptives were standard and if it switched automatically to Welch’s). t-tests require two-value variables (you can't pick, say, Dodge vs Chrysler from a list of automotive brands; you have to create a new variable consisting solely of Dodge and Chrysler), which is a nuisance, especially given the painful interface for recoding. This is the same as in JASP.
Other issues include no support for date or time variables; and no ability to direct output to new variables. You can’t copy and paste from BBedit into Jamovi, but must use its clunky though powerful data transformation system. The program is almost quite large on disk, due to the integrated software — R, Electron, Mantle, Python, and ReactiveCoca.
Other notes. Developer Jonathon Love pointed us to the Jamovi library of extras. A well-illustrated Jamovi blog post goes over its graphics. In our run-throughs, the numbers were identical to SPSS, PSPP, and JASP.
Dive more deeply into Jamovi (full MacStats review).
Listing updated: January 2025 (last software update, December 2024)
Signed by Apple (App store version) • The University of Oslo
“Past is free software for scientific data analysis, with functions for data manipulation, plotting, univariate and multivariate statistics, ecological analysis, time series and spatial analysis, morphometrics and stratigraphy.” That said, Dennis Helsel wrote, “While its name shows its origin (Paleontology), it is a full-fledged stat package which includes multivariate and permutation tests, with a nice interface.” There is good support for geographical and map-based statistics.
When Dennis says “full-fledged,” he isn’t kidding — the range of this software is stunning. Yet, the download is a mere 10 MB — far, far, far less than many others. What’s more, every new version brings a wide range of new features—even 0.0x versions. Summary statistics came in a fraction of a second on a laptop. Our survey file never caused more than a slight pause.
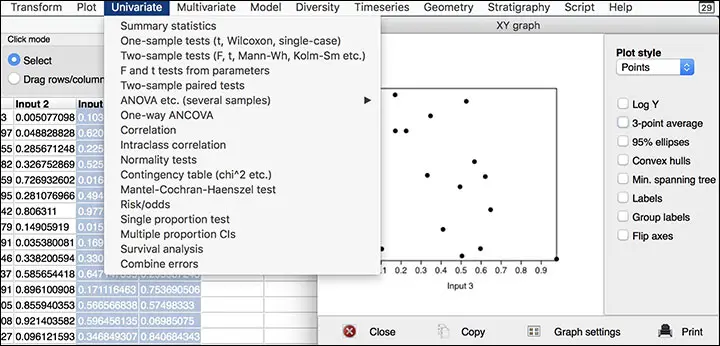
Downsides. Import formats are limited and exclude SPSS, Stata, and Excel files (checked with Past 5); some esoteric formats are accepted, though, and you can copy and paste from Excel (with caution). There are no value labels, but there are variable labels (click Column Attributes and you can enter variable names) and there is scripting.
You can transform data but without the flexibility of some other software; you cannot set missing values. Transformations tend to the complex, leaving out the simple. The "select data and then operate on it” format is clunky; choose data groups instead of columns. There is no way to do independent-sample t-tests by having one variable define groups; you need to have each group in a different column, and only select the data you want to analyze.
Overall, Past is excellent for some of its features but people who don’t need its unique properties are better off with the others listed here.
Dive more deeply into PAST (full MacStats review).
Listing updated: 10/25/2024 • Size: 3.5 GB
SageMath is general math software, with the ability to do statistics. It can be used from the command line or a web browser. You can install it onto a server if you want, and create embedded graphics, typset-style math expressions, and more; it also includes sharing. SageMath was built atop NumPy, SciPy, matplotlib, Sympy, Maxima, GAP, FLINT, and R.
We only rarely recheck these listings.

Copyright © 2005-2026 Zatz LLC. All rights reserved. Created in 1996 by Dr. Joel West; maintained since 2005 by Dr. David Zatz. Contact us. Terms/Privacy. Books by the MacStats maintainer