The Dead Zone: software that appears to have been abandoned
Larry MacPhee pointed out that you can find older Mac software at the Macintosh Garden and at the Macintosh Repository and can use virtual environments to run it. Updated 11/5/2024.
Rescued from death!
Lively Logic
Price: $20 (Mac App Store)
Listing updated: 11/2018 (software updated 2018)
From Ripeware, Lively Logic imports data from CSV files to create line graphs, scatter plots, bar graphs, bubble graphs, candlestick charts, pie charts, and tables. It has 75 functions, automatic updating of when data changes, and customization of graph elements. Available in the Mac App Store, it gained axis auto-scaling, better graph panning/scaling by dragging axes, best-fit curves, and support for Retina displays with version 1.1.
MacRATS
Configurations OS X 10.6 or later; Terminal (tested through Sonoma)
Current Version: 1.01
Standard Price: $500, Pro $650
Software updated 2023; listing updated 2024
MacRATS (Regression Analysis of Time Series) is distributed by Estima.
We’re still hopeful these will come back
DataThief III
$25; unsigned Java program; last check in 2021 showed it may have been abandoned (no movement in Nov. 2025).
DataThief reverse engineers data from a scanned plot, so you can incorporate published data in your plots—handy if you need to compare your data with that of an article that doesn’t provide it in a table.
The current crossplatform version, using Java, can trace most continuous lines, even when they cross themselves, and can convert numbers to other formats (e.g. dates). Version III works on MacOS 8 and 9 as well as X and those other platforms. DataThief II (version 1.21), for older Macs, is still available on the DataThief web site. The original version of DataThief was written by Kees Huyser and Jan van der Laan. Available from Bas Tummers.
Thunderplot
Listing updated 8/2019. Software updated 2018.
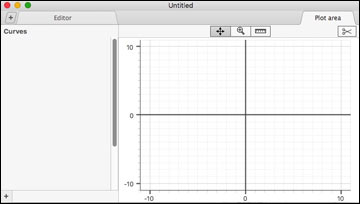
Thunderplot, a native Mac program, was created for quick data visualization; a native Mac program. Its programmer, Vadim Kalinsky, wrote: “It parses contaminated data (like ‘64 bytes from 8.8.8.8’), supports numeric and time axis, expressions, multiple datasets, multiple curves, works quickly with large datasets, has simple and responsive interface, and exports to jpeg/png/etc. It is available in the Apple Store (not currently in the US), and a non-sandboxed (but signed) version is available.”
Our initial impressions are that it is very easy to use, and the snapshot feature should prove very handy to web publishers. The program takes up just 4 MB of space and around 25 MB of RAM, other than data. Despite our poor snapshot, it is capable of sophisticated graphics and has numerous controls.
Graphviz and Instaviz
![]() Configurations: PPC (older versions), 10.5+ (current)
Configurations: PPC (older versions), 10.5+ (current)
Current Version: 2.20.3
Software updated prior to 7-7-13
Listing updated April 2024
Graphviz is an open source drawing package. The Mac OS X version and the overall project have their own web sites. Prepare for a steep learning curve but it may be worth it if you have graphs you do frequently; not what I'd suggest for the occasional one-off. graphviz does not seem to have had any development for around six years, but Instaviz, an iOS version, is on the Apple store; it has shape recognition so finger sketches can become graphs for flowchart.
The Graphviz (Mac version) description on their web site was last updated in April 2008. InstaViz, on the other hand, is selling for $8 on the App Store, and was last updated with version 3.8 in 2016.
MacMCMC
Current Version: 1.6
Listing updated: October 2025 (program updated 12/2022)
Signed, 64-bit; good for El Capitan “or later”
Currently just 20 MB
From the writer of Regress+ comes a free, powerful program to analyze any kind of data. MacMCMC is part of a two-part set—the other part being a free ebook. Data can be imported from plain text (UTF-8). There are 27 built-in distributions, including 16 continuous, 8 discrete, and three homogeneous mixtures — Normal, Bivariate Normal, and Poisson; users can also define their own distributions. There are 15 built-in functions. Reports include MAP, mean, median, mode, and Gelman-Rubin; credible intervals; trace; plots of marginals; and trace comparison for selected chains. The program has other features, described on its web site, along with a sample input, data, model, and output.
Advantages of MacMCMC, in addition to its price, include being a complete standalone Mac program (hence its small size and fast operation); 100% Bayesian inference; parallel processing; and access to low-level options. Users can check for updates from a dropdown menu. The basic method of using the program is to set up the model via a simple text format, easily figured out from the examples or the ebook; load data (in ASCII format); run Compile, run Setup, change any parameters desired, and then run. That yields a plain-text report and a graph which can be adjusted as needed.
Veusz (“Views”)
Python program for OS X, Linux, UNIX, and Windows
Latest version: 3.2 (listing updated 3/11/2020)
A surprisingly capable free program, Veusz creates publication quality output in PDF or SVG formats. Data can be read from text, CSV, or FITS files, and can be manipulated within the program. There is an object-based interface along with command line and Python-based scripting; it can be used as a Python pltting module. Charts include X-Y (with error bars and such), line and function, contour, image, stepped/histogram, bar, vector field, box, polar, and many others, with broken and multiple axes. There is an API for plugins, the ability to capture external data, and command-line scripting; plotting can also be accessed via DBUS and SAMP.
Regress+
Current Version: 2.8 (updated May 2019; prior version was dated May 2017)
Listing updated: 6/28/2023
64-bit, signed, works well in Mojave
Michael McLaughlin’s Regress+ is a free package that includes regression, stochastic modeling, bootstrapping and robust goodness of fit measures. The software and a tutorial are available at the Regress+ web site. Older versions are still available for older operation systems, while version 2.5 is available for OS X and 9.2.
The program is accompanied by full documentation in PDF form which doubles as a statistics reference guide.
Regress+ 2.7, née Regress+ 3.0, was a complete rewrite; it added data modeling (equations and distributions), extensive documentation, and publication quality graphics. Regress+ 2.8 was a substantial upgrade.
This program appears to cover every aspect of regression you can think of. It's graphically oriented but has strong statistics. The code is “more than 100 times faster than before [2.7].” It is somewhat neglected in favor of MacMCMC, a Bayseian program, but is still up to date enough if you don’t have a newer (M1, M2, M3) Mac.
DeltaGraph
Configurations: 68030 or later, OS 7-9 (older versions); Universal; betas may be Lion compatible
Not ready for OS 10.15 “Catalina”
Current Version: 7.13
Price: $299 ($199 academic); upgrades currently at $99 (download)
Listing updated: 4/6/2021
Software last updated: February 2018. Promises of a 64-bit release has been present for at least two years.
Published by: Red Rock Software
DeltaGraph is a dual-platform charting program developed on the Mac, now cross-platform; owned for a time by SPSS, it has been at Red Rock Software for years now. DeltaGraph now has Mac/Windows feature parity and statistical abilities including linear and nonlinear regression. (Amusingly, Cricket Graph did both in 1987.) In 2010, after four years, version 6 was finally released, with a revised interface, cross-platform-friendly files, support for third-party spot colors in PDF and EPS export, and international text support.
The software was last updated in February 2018, according to their site, so be careful. There were no apparent updates since February 2018 on either the Mac or Windows versions, which does not bode well for buyers. (As of March 11, 2020.)
OpenEpi
Current Version: 2.2.1
Last update: 4-6-2013
Listing updated: 10-25-2024
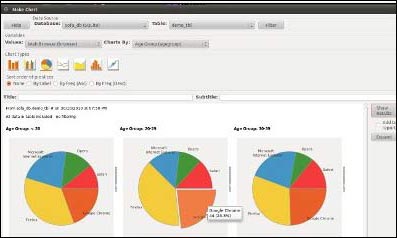
![]() Kevin Sullivan’s open source OpenEpi software is available in four languages; unlike most software, it can be run from a web server or on a regular computer. The programs are written in Javascript and html and should be compatible with Macs and Linux and Windows machines. Test results are provided for each module to allow people to check reliability of their own setup. The software is set up for epidemiology and has numerous key statistics for that field, along with the usual means, medians, t-tests, ANOVAs, powers, etc.
Kevin Sullivan’s open source OpenEpi software is available in four languages; unlike most software, it can be run from a web server or on a regular computer. The programs are written in Javascript and html and should be compatible with Macs and Linux and Windows machines. Test results are provided for each module to allow people to check reliability of their own setup. The software is set up for epidemiology and has numerous key statistics for that field, along with the usual means, medians, t-tests, ANOVAs, powers, etc.
Still dead as far as we can tell
Aabel
Configurations: OS X Mavericks, Yosemite, El Capitan, or macOS Sierra
Current version: 5.2
Cost: $1350 (EDU prices ~$400 cheaper); pricing has not dropped.
Provisionally pronounced “dead” by MacStats on March 11, 2020.
Software and Aabel web site updated November 2016. This listing revisited 2-16-2022.
Publisher/site: Gigawiz
Gigawez’ web site clearly says that the software is not compatible with High Sierra OS 10.13. It has been in “beta testing” for quite some time. The Web site is dated 2017, with the last announcement in November 2016.
The learning curve is steep; operations are conducted in pipelines, making basic menus sparse, with modal dialogue boxes in which the work is done. There is no programming language. It loads Excel files, preserving variable names.
Robin Lake noted its ability to handle a large number of variables and its strong regression tools. Arthur Busbey wrote “this is the envy of more than one Windows person I have showed it to. It has some great niche graphics for the earth sciences that you can't easily get anywhere else. If you have a lot of data to plot, or repeated graphs of the same kind to draw, it's not very flexible. e.g. if you want to plot graphs with a large number of lines (something I do often) I have to go through and set colour of each line individually.”
Dr. Jake Bundy wrote, “Surprisingly useful for multivariate analysis... best feature is the popup window next to the graph sheet listing the variables in the worksheet. If you are interested in hunting for correlations (say), it makes it easy to set var1 as your X, and then use the arrow key to flick rapidly between var2 -> var3 ... -> varN, and watch the plots change.”
Aabel includes map trend analysis, cartographic projection, user-defined multipliers for scientific notations, and statistics plugins modules through a plugin SDK. Version 3 added K-means clustering, the Shapiro-Wilk test for normality, extended ANOVA, extended multiple comparisons, Fisher's z transformation, and much more.
ChartSmith
We wanted to like it, we really did, but we found the interface awkward and unnecessarily driven by OS X ideals. Keynote users may find the integration features handy; you can import data from Excel. The program has multiple axis types, trend lines, error bars, templates, support for Retina displays, and compatibility with Gatekeeper, and some bug fixes for AppleScript. Web site dead when we checked in March 2020.
Citrin
Citrin did interactive scientific graphing and curve fitting. Version 2.0, introduced in October 2009 (roughly two years after 1.1), added Snow Leopard compatibility, and much more. The program was either developed by or acquired by Gigawiz.
dr-ROC
dr-ROC performs summary ROC meta-analysis (Littenberg-Moses method) and other calculations on diagnostic test clinical trial data. It includes a pre-formatted results table and a variety of graphs with easy to use check-box options to display or hide various elements. Forest and logit plots included, along with post-test probability calculations. Menu-driven interface for analysis options including weighted regression and continuity correction. (No longer) available from Diagnostic Research Design & Reporting.
EQS
EQS was developed by Peter Bentler but is now distributed by MVSoft. On OS X, the UNIX version might run under the command line. In Europe, EQS is distributed by ProGamma. The company suggests using Boot Camp, rather than virtualization, to run their Windows version — last updated in 2014 with version 6.2 (version 6.1 dated to 2006). We’re not sure when the last update was, but it was set up for Windows 8.
Fathom
Fathom Dynamic Statistics was a software package designed for teaching basic statistics and data visualization in secondary and undergraduate classes. It appears to have been dropped around 2014.
GB-Stat
GB-Stat was a regression and time series analysis package. It was published by Dynamic Microsystems, Inc.
GraphClick
Similar to DataThief, it could retrieve the original data from a scanned graph or chart. GraphClick was surprisingly flexible, handling error bars, QuickTime movies (frame by frame), deformed axis systems, and numerous other quirks and specialties. As of 1/2021, the web site had disappeared.
GraphPad StatMate and InStat
MacAnova
Configurations Available: Intel processors (10.6+)
Current Version: 5.06.5
Unsigned and not 64-bit
Listing updated: February 2022 (software last updated June 2012)
MacAnova was a free, noncommercial, interactive statistical analysis program developed by Gary Oehlert and Christopher Bingham of the University of Minnesota School of Statistics. It is still available, but no longer maintained. Their web site notes:
MacAnova has many capabilities but its strengths are analysis of variance and related models, matrix algebra, time series analysis (time and frequency domain), and (to a lesser extent) uni- and multi-variate exploratory statistics. MacAnova has a functional/command oriented interface. The Macintosh and Windows versions also have several window/menu/mouse type features. Although the language and syntax are S-like, MacAnova is not S or R.
MacAnova is Intel native, and there is source code available. The program started up very quickly on a Intel Mini and had a fairly good menu system, which output visible code that we could copy and manipulate, or save and run later. It is almost similar to SPSS 4 in that regard, though better integrated into the system and lacking a separate output window. MacANOVA includes linear model and GLM routines.
Mediata Survey
Configurations Available: Mac, Windows
Final Known Version: 3.02
Price: $99
Listing updated 2-15-2022
Surveys were created from a desktop program, in php and MySQL (or PostgreSQL). Quite flexible. Usage was fairly clunky, with lengthy wizards. When the survey is previewed, the html source appears moderately wasteful, with a separate span for questions and question text; but we've seen worse. We were unable to create a survey script on the Mac without an SQL database, suggesting that you’re meant to create the survey on the server itself rather than creating on a desktop and then uploading, which is unrealistic for most people; but there are probably workarounds for that. (thanks to Nadine Macolini for finding this one)
MX
Mx was written by Michael Neal. Consigned to the dead zone in August 2010 due to six years without an update. When we checked in February 2022, the web site had been taken down.
PlainStat
Plainstat was created and designed by Iyus A. Muslimin, statistician and Mac developer, who lived in Bandung, Indonesia. It was an impressive online package but it disappeared in 2013 and seemed to be delivering malware in 2019.
Plot Digitizer
Plot Digitizer is a free Java program for digitizing scanned plots of data, from GIF, JPEG, or PNG; you manually select values by clicking on each data point (which may help in complex graphs that automatic software doesn't do well). It can also be used to digitize scaled drawings, orthographic photos, etc.
There is a semi-automatic feature, for data that trends from left to right; you can paint the data you want with a brush, and “the program will automatically sort out grid lines, noise, etc, and will attempt to digitize the line for you. This feat is accomplished with the help of the open source autotrace image vectorization program.”
Listing updated: 2/16/2022; program updated 10/27/2015.
Salstat
Salstat dates back to the early 2000s and runs on Python. Installing the free version on the Mac may require quite a bit of library-and-Python downloading. The free program, if you can get it to run, has presentable graphics, is relatively easy to use, provides a statistics with parametric and nonparametric tests, shows its own source code, does crosstabs, and “charts, imports CSV, HTML, XML, Excel, LibreOffice and SAS file formats, and can even scrape tables of data from web pages.” The source code listing claims a last-update date of 2014.
StatisticS (data mining software)
StatisticS had a full graphical interface, does a decent variety of analyses (no regression but it has survival and various comparison tests), and the company infers it’s geared to doctors looking to publish their results. ... Overall it’s a good buy - a bargain if you need what it can do - even if it requires some forethought to work with. As of 12/17/09, the company's web site had disappeared.
SOFA Statistics
Listing updated Feb 2022; Code updated January 2021.
Version 1.54—but no Mac version in the 1.5x series.
Not signed; 64-bit
SOFA Statistics (Statistics Open For All) emphasizes ease of use, discoverability, and clean reporting. It can connect directly to database sources, or use data brought in from spreadsheets. The usual statistical processes are available, including one-way ANOVA, t-tests, signed ranks, chi-square, and R; nested tables can be produced with row and column percentages, totals, standard deviations, means, medians, and sums. All this in just 2 MB!
SOFA Statistics is written in Python, using a wxPython widget toolkit. Statistics come via the Scipy stats module. Analysis and reporting can be automated using Python scripts, either exported from SOFA or written by hand. The downside of course is that you have to install it via the command line.
Data can be brought in from Google spreadsheets and CSV files. Dynamic charts use html, SVG, and Javascript.
The down side: Mac development has stopped. Hence its appearance in the Dead Zone.
TSP
Econometrics statistics. The site disappeared sometime before our December 2017 check.
SSP (Smith’s Statistical Package)
Gary Smith’s Smith’s Statistical Package (SSP) was free and user-friendly; sadly, it seems to have ended development years ago, and the web site is no longer up. Last software update 2006.
MacOS Classic software
If you have any of this software already and want to run it, try using a Mac OS emulator such as SheepShaver (for OS 7-9), or vMac (for OS 6 or 7). Without an emulator, few of these programs can be run on a current Mac.
| Package | Notes (updated January 2017) |
| AppleTree | Free program for fitting multinomial binary tree models to frequency data; file-compatible with the DOS MBT program. |
| BuildSim | System design, simulation and analysis package by Tritera. |
| BMDP | Purchased by SPSS; Mac version dropped; sold by SPSS. |
| Cricket Graph | Cricket Graph is still one of the easiest graphing programs, and has fast regression curve fitting. CricketGraph files can be read by DataGraph. |
| Data Loom | Free data visualization program for multivariate data by Carl Manaster. |
| FloStat | Provided basic analysis; it is still published by Senecio Software (as of April 2010). |
| GLMstat | Generalized linear models, spreadsheet-style data entry, many plots and diagrams, statistics, and saving of model specifications. |
| LISREL | ("LInear Structural RELations"), developed by Karl Jöreskog and Dag Sörbom; the program for structural equation modeling for years. By 2008, all mentions of Mac versions were gone. |
| MacCurveFit | MacCurveFit fits a regression curve to user defined functions using least squares. Pricing in 2010 was the same as it was in 2003. It’s gone now. |
| MacSpin | First 3D data visualization program for the Macintosh (and perhaps any personal computer). |
| MathCAD | General purpose math program |
| Minitab | Statistics package used mostly in education. |
| SAS | The last port worked in Classic. JMP is still available on Macs. |
| StatSoft Statistica | Statistica once went head to head with SPSS. In 2010 the Mac version was gone. |
| STATsimple | Shareware with descriptive stats, histograms, student’s t-test and linear regression. |
| StatView SuperANOVA |
SAS bought the Abacus Concepts and dropped these fine programs. StatView and SuperANOVA were fast, capable, and easy to use. Erin Vang wrote, “Global Pragmatica can provide StatView data conversion to .txt, .xls, .jmp, etc. at a basic hourly rate.” |
| Systat | Bought by SPSS Inc, Mac version dropped, sold. |
| ViSta | Free program by Forrest Young, Mac version abandoned around 1999. |
| XLisp Stat | Developed by Luke Tierney. The software home page was last updated in 1998 and the FTP link doesn't work. |