
Before using SPSS, it’s good to know some basic concepts.
SPSS, like SAS, started out as a mainframe program without a graphic user interface; you had to write little programs to do your calculations. You can, and should, still work with SPSS this way, for several reasons:
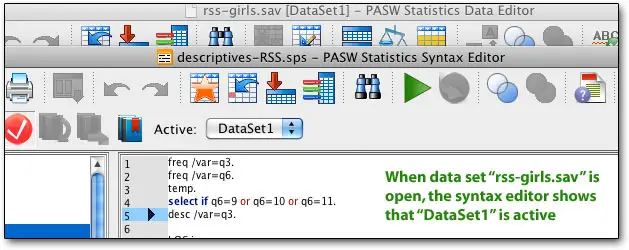
Oddly, though, modern SPSS incarnations require you to go to the File menu and either select New (Syntax Window) or Open (Syntax Window) to type in or paste your own commands. SPSS normally opens with just a spreadsheet showing your data — you can manually change variable names and types if you need to, or alter the data itself, by pressing one of the two tabs on the bottom of the window. But we’re going to play with syntax instead.
Fortunately, now that SPSS is on the desktop, you don’t need to look up unknown commands or options in a thick book; ever since the very first SPSS for Mac (which started at version 4.0, and ran on the Mac Plus) in the 1980s, you could just find the command or analysis in the menus, and then, instead of running it immediately, press the button marked “Paste.”
There’s one more key thing to know: on the mainframe, SPSS could only handle short, alphanumeric variable names, so the developers came up with the idea of the “variable label” — you could have it print a longer variable name, even though the dataset would keep a small one (e.g., you could name a variable Q1, and by assigning the variable label “Question 1,” the printouts would show “Question 1.”
Likewise, to make it easier to view frequency counts and such, you could define names for the values of variables — for example, for a questionnaire, you could assign the data label “Strongly Agree” for a value of 5. These commands are still useful today — so you can use short variable names (which can be handy for typing, or quickly reviewing in a spreadsheet view, or may just be how you get them from the data source) and see the long names on the printout.
The syntax for this example, by the way, would be (capitalization optional — and note that each commands with a period, just like a sentence. There’s a reason for that...):
VARIABLE LABELS Q1 'I really like SPSS'.
VALUE LABELS Q1 TO Q12 1 'Strongly Agree' 5 'Strongly Disagree'.
Normally I only label the extremes, so we can pretend that the distance between any two points on a scale is equal. Also, note that I add value labels for 12 questions at once! Quite a time-saver there.
You can also shorten these commands, a holdover from the days when everything had to be typed, and put in commands to show frequency counts and correlations with the variable “age” — and add a label for question 2. I’m also taking care of missing values, which are assumed to be coded as 0 or 9.
var lab Q1 'I really like SPSS'
/ Q2 'SPSS is easy to use'.
val lab Q1 TO Q12 1 'Strongly Agree' 5 'Strongly Disagree'.
missing values Q1 to Q12 (0,9).
freq /var=Q1 to Q12.
corr /var=Q1 to Q12 with age.
You can also change values quite easily using the recode statement, do regressions, or generate tables (if you have that module). Some examples:
RECODE income (1=35)(2=42.5) (3=55) (4=85) (5=125) (6=150).
and
TABLES /FORMAT BLANK MISSING('.') /TABLES
(Q1+Q2+Q3+Q4) by (labels)
/STATISTICS CPCT ((PCT7.0) '%' ) .
How did I learn that code? Honestly, around 20 years ago, I posted my problem on a newsgroup and an SPSS employee gave it to me!
Here’s some serious power — what if you want to get basic descriptive statistics (such as means and standard deviations), but just for men? Try...
do if gender=1.
desc /var=Q1 to Q12
end if.
Or a regression for people in higher age groups:
do if age>3.
REGRESSION /MISSING LISTWISE /STATISTICS R CHANGE /NOORIGIN
/DEPENDENT Q42
/METHOD=STEPWISE Q1 Q2 Q3 Q4 Q5 Q6 Q7 Q8 Q9 Q10 Q11 Q12.
Comparing group results using t-tests is incredibly easy this way! Let’s say we want to compare two groups of people, the older group and the younger group, using their age (and disposing of all the “middlin’s”):
compute agegroup = age.
var lab agegroup 'Age group (younger = 16 to 28, older = 40+)'.
val lab agegroup 1 'Younger' 2 'Older'.
recode agegroup (16 thru 28=1) (40 thru 110=2) (else=sysmis).
t-test groups agegroup(1,2) /var=Q1 to Q12 Q22 to Q23.
Try that in the graphic user interface of most programs, and it will take you a while; and you certainly wouldn’t want to do it for a monthly survey when you can just re-run the code you created once and keep doing it over and over!
Again, if you don’t remember the syntax for a command, or want to explore options, the menus are there to help you out. But if you just use the menus, you might as well use something like Wizard. If you are interested in the power of SPSS syntax but haven’t laid down the cash yet, you may want to try Stata instead — it’s faster and cheaper, though a bit harder to manage.
Copyright © 2005-2026 Zatz LLC. All rights reserved. Created in 1996 by Dr. Joel West; maintained since 2005 by Dr. David Zatz. Contact us. Terms/Privacy. Books by the MacStats maintainer