
JASP is an easy to use program built around the R statistics program; it comes out of the University of Amsterdam.
Updated October 3, 2025, by David Zatz
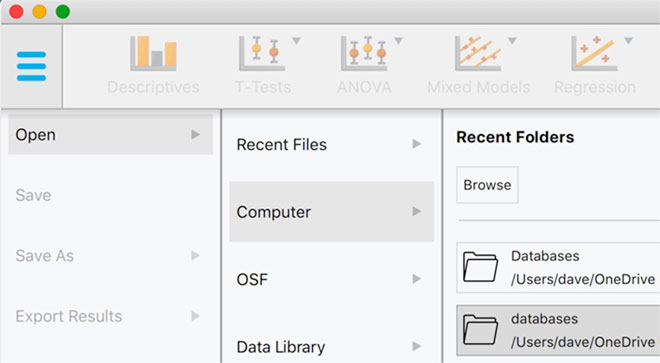
JASP is a Linux native, but runs well on Macs, even using the native Mac open/save dialogue box, once you click on the menu icon, then Open, then Computer, then Browse; and it’s easy to install. Recent versions have made opening large files much faster, including SPSS and Stata imports.
The software feels more native than SPSS (which is native). Calculations and screen drawing are usually quite fast—when you select the tests, they might actually be pumped out before your finger is fully off the mouse. When you make changes, they occur instantly—so if you need a record of what you’re doing, be careful! (I personally wasn’t able to get logging to work.)
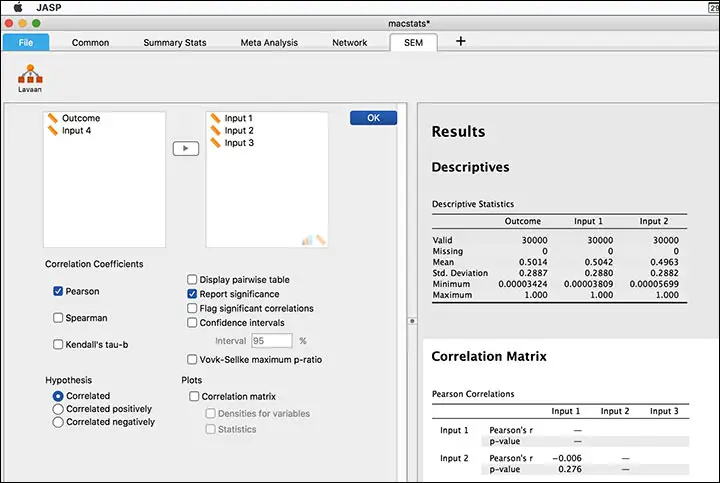
Like Jamovi, JASP has a “two column” setup; it starts out just showing the data view. When you do an analysis, it shows you the options; then, once you start selecting variables and such, the actual analysis is updated on the right side of the screen. If you make changes, they are instantly applied (so if you want to keep a record, you need to duplicate your analysis).
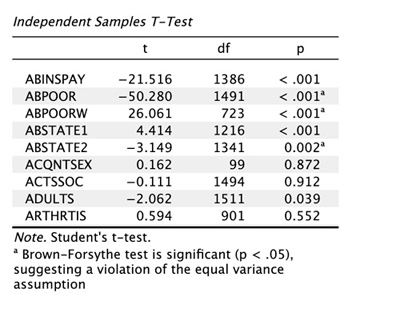
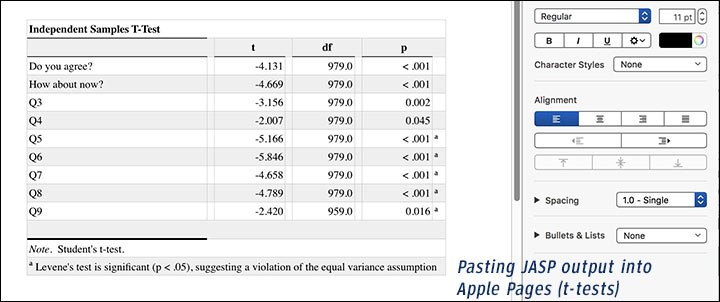
In independent samples t-tests, SPSS and PSPP show both the t-test and Welch’s test, sometimes also called student’s t-test. JASP and Jamovi show a small footnote saying you’ve violated the equal variance assumption; then you should use Welch’s. There’s no option to use whichever test applies (SPSS uses both, and also runs Levene’s F-test to show which numbers you should use, which is arguably worse.)
Survey researchers will be happy to know they can assign value labels — and unhappy to know they must be done variable by variable, without syntax (unless you use the trick shown below). The labels used to be retroactively applied to whatever is in the output window, very rapidly, but now don’t seem to appear there at all.
Side note: You can make working with the data in JASP files easier, arugably, knowing that they are actually zipped SQLite files. If you are used to SQL, you can write scripts to assign variable and value labels using SQL, after unzipping the files; then you can rezip them (I strongly suggest using copies of the files). You can also use phpLiteAdmin to make changes (instructions for using a local copy of phpLiteAdmin). You can move columns into a spreadsheet such as Libre/Open Office Calc or Excel by creating a pipe-separated text file using these Terminal commands:
unzip yourfile.jasp
sqlite3 internal.sqlite "select name,title from columns;" > columns.txt

You can copy individual charts or whole analyses. Copying worked just fine for graphics, and there’s also an easy graphics export. It also works extremely well in pasting to Word or to Dreamweaver, showing up as native tables in both places.
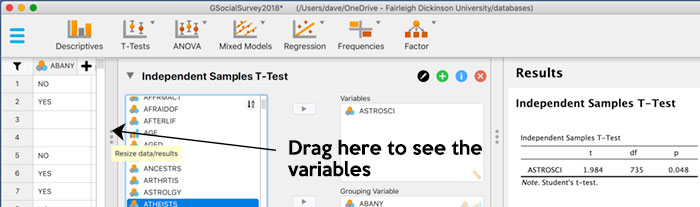
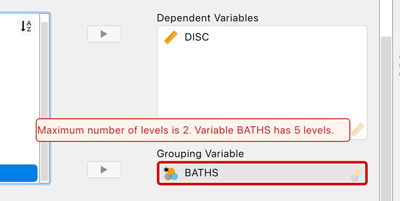
Independent samples t-tests require a variable with two values only (you can use missing values to acheive this). You can’t simply pick the values you want as you can in SPSS. (The easiest way to do this is by filtering out values you don't want; the program accepts a variable with multiple values, only two of which are unfiltered.)
Recoding is clunky but works; it is relatively easy to apply a logarithm or other formula. Simpler "1=1, 2=1, etc" recoding, such as you would use to pound a variable into shape as a grouping variable for t-tests, is much harder! Here’s how you can work around that and make life easy for yourself (essentially, copy into BBEdit, Excel, etc. and do a bunch of search/replaces):
JASP lets you assign missing values to individual variables.
Thanks to Prof. Kim-Oliver Tietze for pointing us to JASP.
JASP project/download page • Other free Mac statistics packages • PAST • Jamovi

Copyright © 2005-2026 Zatz LLC. All rights reserved. Created in 1996 by Dr. Joel West; maintained since 2005 by Dr. David Zatz. Contact us. Terms/Privacy. Books by the MacStats maintainer