
Commercial statistics software for Macintosh computers (Macs)
Some of these packages have an astonishing array of statistical tools; they vary rather dramatically in ease of use, cost, and graphics. Updated March 2022.
General purpose / easy to use / inexpensive
DataTank
Cost: $600. Free trial. Free for students and postdocs.
License gives access to all updates.
Software last updated November 2019; free for students, 2014. Listing updated 2/22/2022.
Published by: VisualDataTools.com
Unsigned. Runs in Catalina.
Winner of the 2005 Apple Design Award for Best Scientific Computing Solution. From their web site:
DataTank is designed for scientific visualization, data mining, and algorithm development, but it is flexible enough to be used for a variety of other uses as well. Like other scientific visualization programs DataTank uses OpenGL to draw 3D graphics, and supports transparency, interactive rotation, multiple light sources and camera positions. DataTank uses the strength of Quartz to generate publication quality vector-graphics as PDF/EPS or anti-aliased bitmaps for use in web pages and presentations. ...
DataTank enables interactive exploration of large data sets. ...
DataTank will perform incremental evaluation, treating data sets with millions of data points and hundreds of thousands of entries the same way as a simple data set that is typed in manually.
Dennis Kahlbaum wrote: “Excellent support. Program is extremely flexible and can be used for graphics, statistics, visualizations, etc; Can produce animations of contours (lines and shading) generated from variably spaced data. Can use ESRI shapfiles.” It is scriptable.
ImageTank and DataGraph are related (and are signed). DataTank is being replaced by ImageTank.
 Wizard 2 / Wizard 2 Pro
Sold through Apple Store: $20/quarter (Pro, $130/year); upgrade discounts
Current Version: 2
M1 processor safe • Big Sur safe • Catalina compatible • Signed
Listing updated: January 2021 (software still under constant development)
Wizard 2 and Wizard 2 Pro — not to be confused with Wizard and Wizard Pro — are surprising packages from Evan Miller (creator of Magic Maps) meant for quick analysis and visualization, without a tortured interface. Wizard imports data with stunning speed, and comes up with summaries (including appropriate graphs). The new versions are incremental improvements over the original, with some surprising and well-implemented new features. Wizard Pro 2 Review.
One of those clever new features is being able to capture properly formatted data from sources as varied as SPSS and HTML — you can feed in a web page and get a table back. This is hard to do, and most software cannot do it, even web software. Wizard 2 also adds a QuickLook feature for SPSS data files, so you can preview databases from the Finder.
Other key improvements include larger graphics in the interface, a new Correlate module, new importers, and full optimization for Apple’s new M1 chip. The one downside is that the software has gone from a one-time-only price to subscriptions—$20/quarter or $50/year, with Wizard 2 Pro at $130/year. Upgrade pricing is in effect, in the form of a first-year discount (from $15 off for the first year for those upgrading from Wizard, and $70 off the first year for those upgrading from Wizard Pro). Even did promise that the original Wizard and Wizard Pro will continue to be supported, and will work on Big Sur and the new M1-based computers. Documents for the two versions will be interchangeable. That means users can decide whether to upgrade and join the subscription treadmill, or stay where they are now.
Wizard / Wizard Pro
Sold through Apple Store: $80 (Wizard) and $200 (Wizard Pro)
Current Version: 1.9.x
Mojave safe / 64-bit / Catalina safe / Big Sur and M1 support promised / Signed
Listing updated: January 2021 (software still under development despite Wizard 2 release)
Wizard and Wizard Pro — not to be confused with Wizard 2 and Wizard 2 Pro — are surprising packages from Evan Miller (creator of Magic Maps) which is meant for quick analysis and visualization, without a tortured interface. Wizard imports data with stunning speed, and comes up with summaries (including appropriate graphs) instantly. We tested it with large databases, including the General Social Survey, and results were practically instantaneous. Wizard Pro supports Stata dictionary (.dct) and some SPSS command files (.sps), surprising features indeed! It also imports from Numbers, SAS, Excel, and even Microsoft Access — something that’s otherwise hard to do on a Mac.
Wizard is set up to instantly provide summary statistics and charts on large numbers of variables, and also does instant correlations and multiple regressions. It's a discoverable program that delivers a level of “pleasant uniqueness” we haven’t seen in a long time.
There is a Pivot interface for producing numeric summaries and saving them as their own tables, á la Minitab. Pivot functions include count, sum, mean, standard deviation, variance, min/max, and percentiles; tables appear or change instantly, and are far easier to modify than, say, in Excel. There is support for frequency weights, optional display of odds ratios, and various other improvements.
Wizard has full date support, Excel exports, numerous tests (Mann-Whitney and Kruskal-Wallis, 2-sample and N-sample Kolmogorov-Smirnov, Negative Binomial, Cox Proportional Hazards), double-precision storage for numeric data, and custom delimiters in imported text files. Following versions continue to increase the scope and quality of the program, on a regular and rapid basis. (Wizard Pro site) Wizard Pro Preview.
StatPlus
Configurations: Can be used with Excel 2004, 2008, 2011, 2016, or Apple Numbers; also has its own built in spreadsheet
Pricing: $195 commercial, $89 student, $119 academic; bulk rates exist
Current version: 6.8
Mojave / signed; 64-bit (yes)
Listing updated: August 2019
Software last updated: May 2019
StatPlus is a fast-loading program that has a small number of menus — one that launches Excel; one that provides statistical analyses; and one that manipulates data. The analyses menu provides simple, easily understood categories, and underneath those are submenus with the actual operations. It’s easy to learn, yet contains numerous statistical methods that are not normally provided by easy-to-learn software, including one, two, and three way ANOVAs, GLM models, and many other analyses. The Help system is fully developed, in a standard Mac format, and is moderately easy to read. Cleverly, StatPlus launches Excel automatically when you start it up, saving a step and making it seem more seamless.
The team moved to the US in 2013, causing some support issues, but has completely revamped their web site and issued new versions of the StatPlus, now supporting Apple Numbers as well as Excel. Excel 2016 support is coming along with a standalone version that has its own spreadsheet.
Acastat
Configurations: Mac (10.7+), Windows
Acastat version: 2200.6.1 (updated 12/30/2021)
Listing updated: 2.22.2922
Compatibility: 64-bit ; requires MacOS 10.13 or more
Price: $10
Acastat handles up to 100,000 cases and 100 variables, depending on system memory. It runs on PPC machines with OS X 10.2 and up, or on Windows XP. It does frequencies (with chi-square goodness of fit), lists, descriptives (by subgroups), diagnostic accuracy measures, crosstabs with various related statistics, t-tests, one-way ANOVA, correlations, simple and multiple regression, logistic regression, and appraisal analysis. There’s a real estate module for tax assessments, and a setup to try to generate charts from inferred data in summary statistics.
The software appears to be easy to figure out and learn, providing most of the statistics that most people use day to day, and some that one has to pay extra for from SPSS. We did not test Acastat's accuracy but overall it appears to be a very promising entry. (Mac App Store version)
Acastat StatCalc
Configurations: Mac , Windows
Version: 9.18 (updated 10/1/20)
Listing updated: 2/22/2022
Compatibility: 64-bit
Price: $6 (via Mac App Store); iPad version, $2
StatCalc is designed to do the most common, basic tests: comparing means and proportions, showing frequencies and descriptives, doing weighted means, chi-squares, goodness of fit, and such. The Decision Tools module explores price elasticity of demand, queuing theory, constant dollars, and decision tables.
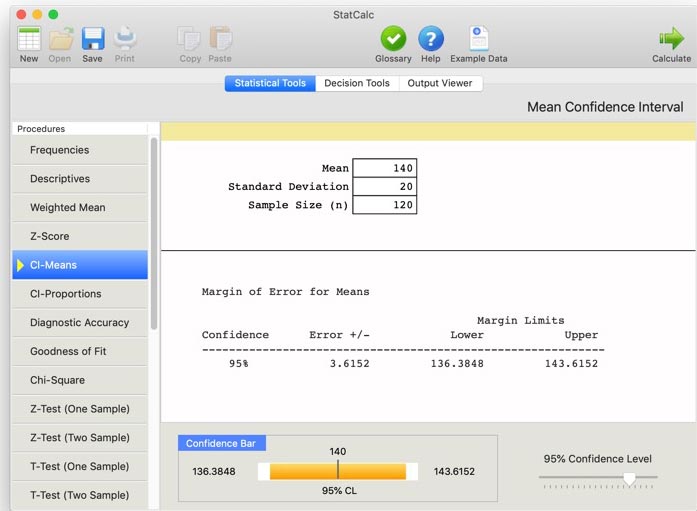
It is very easy to use, fast, and cheap — and continuously maintained. There is an iPad version, too.
GraphPad Prism - Prism Review
Current Version: 9 (released 2020)
64-bit: yes, starting with Prism 7 (Catalina compatible)
Price: via subscription only, $276/year; $174/year academic; $114/yr student; or $40/month
Listing updated: 10/2020; last code update, 10/2020
GraphPad Software [(800) 388-4723, +1-858-457-3909] sells Prism, a multi-platform package that emphasizes biostatistics for laboratory work. GraphPad’s CEO and founder, Harvey Motulsky, wrote: “We release new versions of GraphPad Prism every 3-4 years, and Mac and Windows development are done nearly simultaneously.”
GraphPad’s Prism is a strong platform for exploratory statistics and graphing, providing the usability of graphing software with many advanced statistical capabilities. Numerous graph types are available along with flexible regression curving. For more details, read our GraphPad Prism review.
Works from Excel
MegaStat
Current Version: 11.2
Requires Excel; works on Intel, PPC, Windows
Listing updated: 5/2017
Software last updated: 2017
MegaStat is maintained by J. B. Orris, Butler University, and distributed by McGraw-Hill. The software uses Excel only for “data entry, data transformation, printing, and file management,” but avoids using Excel’s disreputable math tools. The software has evolved from J.B. Orris’ Microstat; the current version is written in VisualBasic as an Excel plugin, though a standalone version is planned for the distant future.
MegaStat can deal with stepwise regressions, large factorials, time series/forecasting, descriptives, frequencies, nonparametrics, QPC sharts, and numerous hypothesis tests. In short, MegaStat packs all the power most people will ever need into a relatively inexpensive, easy to use package. The down side is that it’s moderately slow, has no scripting language, and requires Excel; and you may need to buy a textbook to get it, though J.B. Orris is considering a shareware or commercial version. On the Mac, some of the buttons and dialogues are hidden by formatting problems; but we tested MegaStat’s output to find that it was identical, to six decimal points, with that of Stata.
XLSTAT
Configurations: Mac OS X 10.6-10.11, Windows for Office 2011 and Office 2016
Pricing: Numerous versions and options. Base product/commercial license: $275.
Current Version: data not available
Listing updated: Jan 2017
XLSTAT runs inside Excel, and supports Mac OS X with Excel 2004 and X, with support promised for Excel 2011 after its release. Their calculations do not depend on Excel; the code is robust C++ code and the product has been on the market for ten years, with over 25,000 customers. There are numerous modules, all but three of which are available for the Mac; and there is academic and standard pricing, with perpetual and annual licenses. Modules can cost considerably more than the base program.
Big and comprehensive and priced accordingly
Stata
Pricing: Versions start at $445 (educational discount). There are government and educational discounts.
Current Version: 16
Mojave? Not on web site, which lists “10.11 or newer” only
64-bit only
Listing and software last updated: June 2019
Software is updated roughly once per year
Stata has frequent, automatic updates between releases, and simultaneous releases across platforms. Their price is much lower than SPSS, and there are no “gotcha” costs for extra modules. Stata's Mac support has been excellent for many years, unlike IBM/SPSS. (See our Stata 11 statistical software review.)
Stata is incredibly capable, with a macro language, a syntax language, a matrix language, a massive collection of user-contributed modules, Python integration, a spreadsheet for data manipulation, an advanced variable editor, copy and paste to word processors (without formatting), and extreme depth and breadth in statistical functions. Stata graphing is advanced and more “print-ready” than SPSS, surprisingly.
Stata now generates web pages with mixed text, graphs, and such, and supports Markdown and dynamic documents; it can generate Word, Excel, or PDF files, and has built in versioning. Version 15 brought an enormous number of new features including extensions to SEM, ERM, nonparametric regression, and spatial autoregressive models.
JMP
Configurations: Universal Binary; past versions were 68000, PPC, etc.
Current Version: 14
Price: $1,785 per year (sold by subscription)
Mojave? Yes, if the splash screen is disabled (see JMP for details); certified for High Sierra
64-bit? Available
Listing updated: 10/2018
Software updated: 2018
SAS Institute’s JMP started out as a Mac data visualization program. It now competes with Stata and SPSS, boasting syntax, journaling, and comprehensive statistics and design tools. There are full demos, and a student version (JMP IN).
JMP is responsive and launches speedily and feels like a real Mac program. Importing a large data file from Excel was almost instant and accurate, with correct variable types and names. Opening a spreadsheet of four variables and 30,000 entries was instant and, in the time it took for SPSS to do nothing, JMP had already run descriptives. Numeric output of JMP in our tests (which used 30,000 randomly generated 15-digit numbers) was identical to SPSS, Stata, JMP, and Megastat; JMP was the fastest of the group in 2009.
Regressions were instantaneous, including multiple multiple, high-resolution plots we could copy directly into Photoshop, summary of fit, analysis of variance, parameter estimates, residual plots, actual by predicted, etc ‚— using 30,000 cases. From the output window, we could copy tables and plots, and even change parameters or run additional tests from convenient submenus.
With JMP 10, SPSS import was greatly improved, and a large SPSS formatted file (the 2010 General Social Survey) was imported in just a few seconds; manipulations were still fast. We will be using that data set soon to re-compare SPSS, JMP, and Stata Intercooled.
Note: due to the crazy-high price, we don’t plan to review newer versions of JMP.
We didn’t realize just how fast Stata was until we analyzed the General Social Survey with it. JMP is absurdly fast; graphing a 3D scatterplot of three variables, with 2,400 cases of each, was instant, and we could then rotate the plots in real time.
As a side note, SAS had purchased the popular Mac program StatView from Abacusl which had bought it from BrainPower; but SAS quickly killed it, preferring its own JMP. StatView worked in the Classic to OS X 10.4; it still runs under Basilisk or SheepShaver.
JMP Pro for Academic Research
3-year license for JMP Pro for Academic Research normally $2,995; discounted to $1,995 10/16/2017-12/7/2017
We have not gathered much information, but JMP claims JMP Pro for Academic Research includes software to easily gather, process, and clean data; to analyze and model; and to interactively visualize and share insights. It can pull data from competing software including R and SPSS, and supports mixed models and multi-level modeling; semantic analysis and topics analysis for text data; data mining and neural networks; cross-validation; automatic model comparison; penalized regression; and other capabilities.
Statistix 10 (not available on Macs)
Configurations: Windows only
Price: $495 (academic, $395)
Listing updated: 3/2022
Statistix is a menu-driven program, which still supports Windows 98 but also runs on Windows 10 in 32 and 64 bit mode. First released in 1985, it is menu driven only—no command language. It claims to provide publication quality plots. There is no Mac version.
Gauss
Current version: 18
64-bit: yes, at least back to Gauss 16
Mojave? No idea.
Listing updated: 10/2018
Gauss is a widely used, “big-time” package...but let’s let Aptech Systems, the developers, say it:
The GAUSS Mathematical and Statistical System is a fast matrix programming language widely used by scientists, engineers, statisticians, biometricians, econometricians, and financial analysts. Designed for computationally intensive tasks, the GAUSS system is ideally suited for the researcher who does not have the time required to develop programs in C or FORTRAN but finds that most statistical or mathematical "packages" are not flexible or powerful enough to perform complicated analysis or to work on large problems.
Joel West, the creator of this site, wrote: “Gauss was never available on Macs before, and is considered the high-end statistics package for economic research. Here's a good third party resource for Gauss.”
The last time we checked the web site, we were unable to discover pricing or compatibility information, though it had previously shown 10.9 compatibility.
mathStatica
Current Version: 2.7
Requires Mathematica 9, Intel Mac; previous versions PPC compatible
Listing updated: 1-2017
mathStatica is an add-on package for Mathematica which provides algebraic and symbolic solution to statistical problems. Thus, it is supported in the same configurations as Mathematica for the Macintosh. It is published by MathStatica Pty. Ltd. It now provides an arbitrary-precision numeric engine for accuracy, especially in highly iterative processes.
The software is sold as mathStatica Basic (bundled with the associated book, Mathematical Statistics with Mathematica) and as mathStatica Gold ($69 upgrade from mathStatica Basic).
SPSS (IBM)
Current version: 27. Final PowerPC version was 16; final Classic version was 12.
Pricing: by subscription ($99/per month and up), add-on modules are $79 each
Mojave? Yes
64-bit? Yes
Academic cost: Grad and Student Packs start at around $70 for one year. We recommend against getting “hooked.”
Listing updated: November 2020
See our starting guide to using SPSS statistical software and our review
SPSS was the industry standard statistics package when it was purchased by IBM; the price was jacked up, and then switched to a subscription model. Many features require pricey add-ons. The user interface is Java-based and very slow, especially when opening windows.
SPSS Mac easily exchanges data, syntax, and output files with the Windows version, and with most older versions (even those which can’t deal with long variable names). Output file formats changed a few years ago, but can be read in the free PSPP if needed.
There is no shortage of fine statistics software at prices far below those of SPSS. Based on our use of Release 27 for Windows, the changes have been incremental, not revolutionary, since version 11. The software looks prettier but is slower. There have been some welcome changes (better output formatting, more sensible option setting) and some that are less than welcome (slower interface).
SPSS 10.08a can run in Classic mode under OS X on PowerPC machines if you (1) right-click (or control-click) on the SPSS 10 program package (not the alias) and select "Show Package Contents;" (2) drag out the SPSS 10 for Macintosh alias from the package; (3) close the folder and use the alias you just dragged out of the SPSS package to start the program.
Free alternatives that use SPSS data files: JASP, Jamovi, PSPP (SPSS clone).
Stat-Ease Design-Expert
Current version: 11.1
Price: $1,325/year (academic discounts available)
Software last updated Nov. 2018, listing created Nov. 8, 2018
Size: 315 MB
With Design-Expert software, “you can not only screen for vital factors, but also locate ideal process settings for top performance and discover optimal product formulations. Easily view response surfaces from all angles with rotatable 3D plots. Set flags and explore contours on interactive 2D graphs; and use the numerical optimization function to find maximum desirability for dozens of responses simultaneously. For a list of features and more, scroll to the bottom of the page.” (We will review this soon; we did a quick run-through to get the feel of it.)
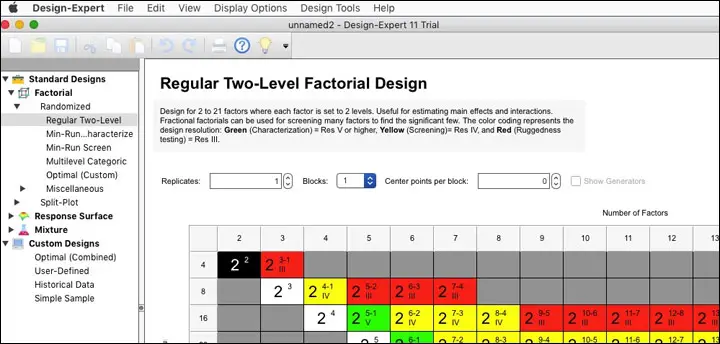
This is not software for those who only vaguely remember some high school or college statistics; it’s for a relatively sophisticated audience. That said, it can make some difficult decisions easier, as the blurb above promises. You can adjust many aspects of the software through the preferences, including just about type of type size, other than the little explanations in the boxes (e.g., in the illustration above, where it says “Design for 2 to 21 factors...”) which is quite small.
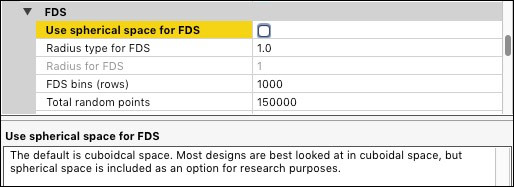
Once installed, Design-Expert reloads quickly, bringing the user to a choice of using a wizard, which is fairly thorough in its descriptions; creating a new design in a more traditional way; or opening a saved design (using the native Mac dialogue box). The program uses the Mac menus and feels native in every way, including responsiveness; preferences are in the right place.
“Special purpose general software”
Easy Chi-Square Calculator
Current version: 1.1
Price: 99¢ from the Mac App Store
Software last updated August 2018, listing created August 28, 2018 and updated October 17, 2018.
Mark Brown’s 99¢ app on the Mac App Store is designed for one and only one purpose: conducting a chi-square test of independence from a contingency table of any size. You can hover over cells to see the expected value, too. Mark said he’d work on importing from Excel and such for a future version; in the meantime, it’s hard to argue with an easy-to-use program that does one thing (well, two, including viewing expected values) but does it very well. (We have tested it and it looks just about the same on our screen; the typeface is a little more readable now.)
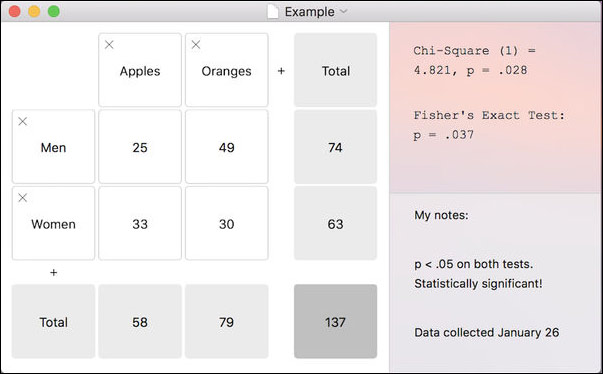
Not seen in the screen shot: when you hover over a cell, it shows the expected value. You can easily add columns or rows by clicking in the plus signs, so it's not just for 2x2s. You can change the number of decimal places for the Chi square or p, and use a Yates correction factor. Data entry is easy — click in the first cell, type in a value, then just press tab to get to the next cell and the next, until you're done (you don't have to click on each cell). This is, in short, a fast, easy, one-trick pony that does what it says it will, and won't break your budget (or at least it won't break your budget by more than 99¢).
Kaleidagraph
This graphing program computes ANOVAs, including repeated measures ANOVAs. See its listing on the Graphing page. An add-on for Mathematica is available.
Online
StatCrunch
![]() Pricing: $25/year or $15/six months; free to faculty; bulk rates
Pricing: $25/year or $15/six months; free to faculty; bulk rates
Listing updated: Jan 2021
StatCrunch has been purchased by Pearson. It is a statistics program on the web. It has the usual range of basic statistics, from t-tests to regression to ANOVA and nonparametric tests, with a wide range of graphs also available, and works from Excel or text files. StatCrunch will also store your data within reason; it seems to work fine with Safari. For those with low budgets or infrequent needs, StatCrunch's price is attractive, and you can use other members’ data.
Specialty software
Time Series Software
gretl
gretl does time series and other statistics; see “other software,” below.
Bee Docs Timeline 3D
Price: free-$25
Listing last updated: 1-2-2017
Available in the Mac App Store
Makes pretty timelines.
kSpectra
Version 3.9; Automator, Spotlight support;
Price:
$100, available in the Mac App Store, Lite version $10; volume discounts
Listing updated 2-18-2020; software updated 2020
Published by Spectraworks, kSpectra Toolkit is “a set of programs for advanced spectral analysis of univariate or multivariate time series arising in many of the physical sciences, ranging from electrical engineering and physics to geophysics and oceanography, as well as biomedical sciences. The toolkit contains procedures for estimating the spectrum of a time series, decomposing the time series into trends, oscillatory components, and noise, and reconstructing the contributions of selected components of the time series,” according to the web site.
Dennis Kahlbaum wrote: “makes time series analysis relatively easy via GUI and built-in functions/methods.”
Typesetting and Graphs
LiveMath and PrintMath (formerly MathView, Theorist, MathEQ, Expressionist)
PrintMath 4.09, LiveMath 3.6
LiveMath: $129/year individual($69/year for students); $199 perpetual license; $249/year commercial
PrintMath: $39/year individual ($20/year students); $59 perpetual; $79/year commercial
Listing last updated: 10-9-2021
LiveMath and PrintMath, the latter for typesetting equations; only claims compatibility through Mac 10.14, “definitely will not work on Catalina” due to being 32-bit. Possibly in the process of being abandoned. Free trial for 30 days.
General math software
Statistical analysis (particularly time series analysis) can also be done using general-purpose mathematical software (especially with optional or standard plugins) such as:
- Mathematica: Feature/version parity across Mac, Linux, Windows, and UNIX versions.
- MATLAB: Gets considerable use for statistics, particularly Bayesian.
- Maple: Windows, UNIX, and Linux also available.
- IDL: OS X or UNIX native
Other software
ActivStats
Configurations available: MacOS X, Windows
Price: free
Listing updated 10-3-2021
Multimedia product designed to teach college-level statistics (with emphasis on DataDesk).
The site point sout that ActivStats Tools are based on the ActivStats statistics e-book, which includes t-tests, chi squares, and F tests; mean and regression boostraps; and randomization tests to do inferences. “These tools provide built-in datasets, but can also be used with any tab-delimited text data file for which the first row holds variable names.” Distributed by DataDesk.
 gretl
gretl
Configurations available: OS X (Intel only)
Current version: 2016e
Price: free (open source)
Listing updated 1/2/2017
gretl is a cross-platform software package for econometric analysis, written in the C programming language. It is is free, open-source software that reads in numerous formats and can link to R. Features include an easy, intuitive interface, a wide variety of estimators, time series methods, output in tabular, equation, or LaTeX formats, a scripting language, command loop structure, and GUI for fine tuning graphs. (Thanks, Rudi Bekkers).
Insights (née Knowledge Miner (yX))
Configurations OS X 10.9 or newer, “optimized for Big Sur”
Current Version: 6
Price: Free basic version; ranges from Advanced ($129) to Ultimate ($1,990) with $35 student version and educational pricing
Listing updated 10-3-2021; software last updated Feburary 2021 to fix Big Sur bugs. Last major update, 2019.
Knowledge Miner’s data mining tool can now stand on its own, without requiring Excel. It can build predictive and descriptive models — “explicit and complexity minimized mathematical models,” with the ability to self-select inputs and show their importance. It has three languages — English, Spanish, and German.
Since Insights is now standalone, it’s able to run as full 64-bit software with parallel processing, boosting speed dramatically. Excel support is optional, for importing directly from Excel 2011 or 2016. Models can be exported in various formats.
The $129 Advanced version forecasts complex time processes without models, automatically runs simulations or forecasts real-time data (storing up to 5 steps ahead — the Ultimate version goes up to 120), exports models in generic form, can run up to 100 inputs with 50,000 samples, and supports up to 100 forecasting steps.
The Professional edition also does cost-sensitive modeling (including ROC and cost curve plots), also exports models in Objective-C and AppleScript, can run up to 2,000 inputs, with one million samples, and has unlimited forecasting steps. Ultimate adds self-organization modeling of interdependent, complex systems, can export systems of equation in Excel, and can handle 25,000 potential inputs.
The company’s own description:
INSIGHTS is original 64-bit parallel software for building predictive models from data, automatically, by evolutionary, self-organizing modelling approaches. Taking observational data that describes a problem, system, or process, the software constructs a working mathematical model... its AI-powered, self-organizing, modeling algorithms allow users to easily extract new and useful knowledge to support decision-making. ... Users in nearly any field can employ the easy-to-use software to analyze noisy data sets and build powerful models, which can be used to help to gain new insights into complex phenomena, predict future behavior, simulate "what-if" questions, and identify methods of controlling processes.
The software promises to hide the processes of model development, dimension reduction, variable selection, noise filtering, and model validation, self-organizing linear or nonlinear, static or dynamic regression models, to generate the equation that best describes the data. It also checks to see if the final model “reflects a valid relationship or if it just models noise.” It can create models for Status Quo or What-If problems, outputting models and model ensembles in ready-to-use Excel, Python, Matlab, AppleScript, or Objective-C code.
Data transfer / translation with Stat/Transfer
Version: 15
Price:
$499 (commercial),
$
179 (academic subscription; $349 perpetual),
$
99 (student one year subscription)
Listing last updated: 10-3-2021 (prices not checked)
Stat/Transfer can translate to and from most common statistical formats. It works surprisingly well, though you should check to make sure it can make the exact transitions you need. Version 15 brings support for Catalina and Stata 16.
Specialty software from Marley Watkins
This software is available from Marley Watkins at http://edpsychassociates.com/Watkins3.html (Thanks, Tricia Jones). Some of this software is PowerPC based and will not run under Lion; some are OS 9 based; other programs are Intel-based or universal binaries. There are some Excel spreadsheets, some FutureBASIC and BASIC programs as well.
- MacParallel Analysis: tables of eigenvalues produced by Monte Carlo simulations.
- Monte Carlo PCA for Parallel Analysis: computes Parallel Analysis criteria (eigenvalues) via Monte Carlo simulation.
- r To z Conversion: calculates r-to-z and z-to-r.
- Ability-Achievement Discrepancy Analysis: regression-based prediction of achievement for determination of a severe ability-achievement discrepancy.
- Coefficient of Congruence: calculates the coefficient of congruence for comparing factor solutions from different studies or different samples.
- Diagnostic Utilitity Statistics: calculates diagnostic efficiency statistics: sensitivity, specificity, false positive rate, false negative rate, positive and negative predictive power, odds ratio, Kappa, etc.
- ROC Analysis: graphs the Receiver Operating Characteristic (ROC) curve and calculates the Area Under the ROC Curve (AUC) using a nonparametric method.
- Chi-Square Analysis: calculates the chi-square statistic for 2x2 to 10x10 contingency tables. Also calculates the contingency, phi, and kappa statistics.
- Probability Calc: calculates the probability of Z, t, F, and chi-square values.
- MacBonferroni calculates Holm's sequential Bonferroni method to maintain error rates at a desired alpha level.
- RandomNum generates random numbers within a range specified by the user.
- UNITcalc calculates profile scores on the Universal Nonverbal Intelligence Test as per Wilhoit & McCallum (2002).
- Simple t calculates independent and dependent t-tests from group data (mean, standard deviation, correlation).
- MacKappa calculates general and partial kappa coefficients for nominal data.
- CAcalculator-Revised calculates chronological age when given date of birth and date of test
- rDiff calculates the reliability of difference scores, given the reliability of two tests and the correlation between then.
- rProphecy calculates the Spearman-Brown 'Prophecy' formula that estimates the reliability of a test if its number of items is altered.
- Effect Size Calculator calculates effect sizes (Cohen's d, r, Glass's ɢ, Common Language Effect Size) given appropriate means and standard deviations.
- MacOrtho transforms an hierarchical higher-order factor analysis solution into an orthogonal solution as described by Schmid and Leiman (1957).
- MacMahalanobis calculates Mahalanobis distance for multiple cases, given entry of an inverted covariance matrix.
- Pairwise Tests calculates three Pairwise Tests: simple Bonferroni adjustment, Holm's sequential Bonferroni method, and Benjamin and Hochberg's False Discovery Rate.
- alphaN estimates the sample size needed for a specified coefficient alpha, given the Type I error rate and effect size.
- rSim interactively simulates how the 95% confidence interval of the correlation coefficient and the statistical significance (p ≠ 0) vary as a function of sample size.
- ASCA Assistant for the Adjustment Scales for Children and Adolescents (ASCA). It also performs syndromic profile analysis, discriminant analysis, and situtype analysis. Only for those who own ASCA manual and protocols.
- Invariance calculates indices of factorial invariance: the coefficient of congruence, a chi-square goodness of fit test, and Cattell's Salient Variable Similarity index.
(See free and open-source Mac statistics software.)
Didn’t find what you wanted? Try graphing / visualization (sometimes with statistics built in) and The Dead Zone
Sponsored by Toolpack Consulting
Copyright © 2005-2024 Zatz LLC. All rights reserved. Created in 1996 by Dr. Joel West; maintained since 2005 by Dr. David Zatz. Contact us. Terms/Privacy. Books by the MacStats maintainer