
Free statistics software for Macintosh computers (Macs)
Updated 4/24/2024
Getting error messages when you use free statistical software for Macs? See our “signing page.”
Skip forward to the software listings.
Meet the free SPSS competitors
I have taught statistics using JASP, Jamovi, and PSPP. Each has advantages and disadvantages, and there is nothing stopping you from using all three depending on what you are trying to do. Ironically, each one has a much faster user interface than SPSS—and all import and export SPSS .sav and syntax files.
JASP is a fork of (it was originally based on) Jamovi; both are still under active development, which have fairly similar user interfaces, and both saved a good deal of time and trouble by not reinventing the wheel—they are essentially user interfaces for another statistics program, the hard-to-learn-and-use R.
| JASP | Jamovi | PSPP | |
|---|---|---|---|
| Regression | Has stepwise, not multi-step | Enter with multi-step | Enter (one step) |
| Recoding | Via linked data in spreadsheeet | Within program | Easy, fast, within program |
The programs have spreadsheet-like data editors, but it's best to prepare information for them somewhere else; they let you computer variables, but in a clunky and hard to use way. Importing variable labels and missing values from SPSS files sometimes fails on Windows. Applying value or variable labels to JASP or Jamovi can be painful at best—they have to be done one variable at a time.
| JASP and Jamovi | PSPP | |
|---|---|---|
| Signed | Yes | No |
| Statistics engine | R | Native |
| Output | Copies as tables | Copies as plain text |
| More modules? | Yes | No |
| Program windows | Unified | 2-3 windows |
| Syntax | No, but shows R code | Yes, SPSS |
| Contextual help | Yes | No |
| Command logs | Yes (can’t easily replay) | In theory |
| Mac open/save boxes | No | No |
| SPV file viewer | No | For SPSS below 28 |
| Frequently updated | Yes | No |
| Download size | Jamovi 415 MB JASP 1.3 GB! |
Small (~124 MB) |
| Cloud version | Yes | No |
JASP and Jamovi share lightning-fast speed; a wide range of statistics, with extra plugins on Jamovi; and easy installation on Macs, Windows, and Linux. Their basic interface has an Office 365-style open/save/print/export tab; options on the left, output on the right layout; instant changes to the output if you change the input; and export of both data and output, as desired. JASP does not let you set missing values for one variable at a time; you're supposed to deal with this in a spreadsheet. JASP is set up so you edit data separately, and if you can live with this, it’s probably the best of the three overall.
Quick video comparing JASP and Jamovi...
PSPP is unique in cloning an old version of SPSS quite well, making it very familiar to those used to SPSS. It has some nasty bugs and quirks, so JASP and Jamovi may be better options unless you do a lot of data manipulation, or want to have a journal and use syntax. Not having a real Mac user interface makes PSPP painful at times, but it’s probably the best of the bunch for Linux users.
When considering each of these for my class, these are the pluses and minuses (this table really is best on a desktop, sorry!) —
| Program | Unique Goodness | Deal Killers |
|---|---|---|
| JASP |
|
|
| Jamovi |
|
|
| PSPP |
|
|
| SPSS |
|
|
The SPSS competitors in more detail
All three of the potential SPSS replacements have some oddities, as shown in the table above, which may not be addressed in the foreseeable future; the developers are adding a great deal of statistical capability without addressing these issues.
PSPP: The SPSS Clone
Current version: Mac version 2.01; MacPorts+Brew source at 2.00; source at 2.01
Listing updated 4/24/2024
Last known software update: March 21, 2024 (including Mac binary)
Download size: quite small!
Note: Unsigned software; MacPorts, Homebrew versions available
PSPP is a free SPSS clone with a Mac version you can download from this site (it’s unsigned). You can also build from source, but that's another level of effort (and, with MacPorts, a crazy amount of overhead to build one program). The pre-compiled Mac version is under 60 MB, and loads quickly, making SPSS look like a sloth. This would be my favorite SPSS clone, if not for a number of problems—the largest one being excess Mac and Windows bugs. Its ideal environment is Linux. Development is slow and doesn’t usually address any of these bugs. Here’s a video on installing it.
The interface is similar to SPSS, with menus in the windows rather than the menubar, and a frustrating version of the open/save box. It can’t use custom folders (including OneDrive and Dropbox). PSPP does import SPSS data files, long variable names, and variable and value labels. Common options are included in some dialogue boxes without the need to dig deeper.
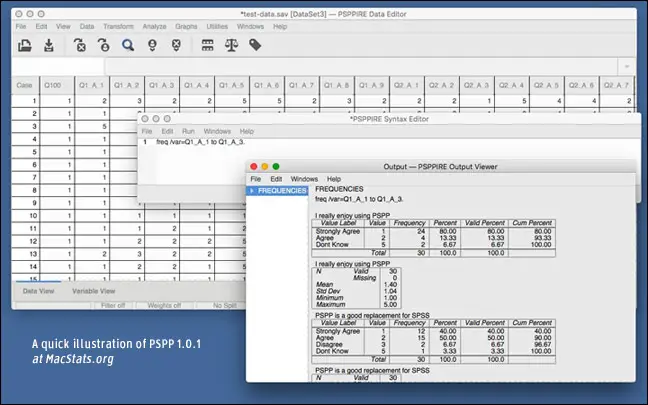
You can copy from the output window—but only from the left-hand contents, not from the main pane. The output window yields plain-text, delimited by spaces and pipes. There’s also no way to clear anything from the output window.
Regression does not allow for multiple step entry or forward, backward, or stepwise models.
Our getting-started guide for SPSS is also helpful for getting started with PSPP.
The capabilities are impressive, including graphing. It’s a fine way to avoid spending thousands of dollars on the big cheese. A great deal of work has gone into the analyses themselves, and the routines the program does run are well fleshed out. The user interface is awkward, but it’s fast; while on SPSS it takes a long time for windows to form and disappear.
Version 2 boasts ctables, layered frequencies via split file, new aggregation functions, more symmetric-measures crosstabs, display macros, and show environment support. When adding, matching, or updating files, string variables with the same name can have different widths. pspp-dump-sav and modify vars have been removed; and GIMP has been replaced by the smaller rsvg-convert from librsvg2. It builds easily from source via Homebrew (to upgrade Brew installations, try just brew upgrade from terminal; it should upgrade everything on your consent, including PSPP); it is also available as a MacPorts formula.
Downsides.
- PSPP can't find .sav files unless you specify “all files.”
- PSPP only has a single-stage Enter for regression, making it quite clunky. There is no stepwise, forward, or staged Enter.
- Recent Files only works now and then and only if you specify “all files.”
- Some commands are not available in abbreviated form.
Until SPSS wised up, you could use PSPP to open SPV files with the original formatting. This stopped working with SPSS 28 (more so with 29). Even SPSS 28 can’t read many SPSS 29 output files! There is no SmartViewer for Mac past version 24, so you can’t read these files with SmartViewer either. Other than annoying stats faculty, it’s hard to see why these changes were made, but it’s yet another good reason to ditch SPSS itself.
JASP: the first really good effort at making R more accessible
Current Version: 0.18.3
Listing updated: 4/5/2023; program updated Q1 2024
Not signed by Apple (you may see a warning) — also has cloud version
906 MB
download, 1.8GB on disk!
JASP was created as “a low fat alternative to SPSS, a delicious alternative to R,” by people at the University of Amsterdam. You can run it “in the cloud” — in your browser — for free.
JASP uses the native open/save dialogue box with a weird Microsoft Office-style setup requiring more than one click. It has extensive Bayesian statistics capabilities which may confuse people who are not looking for them.
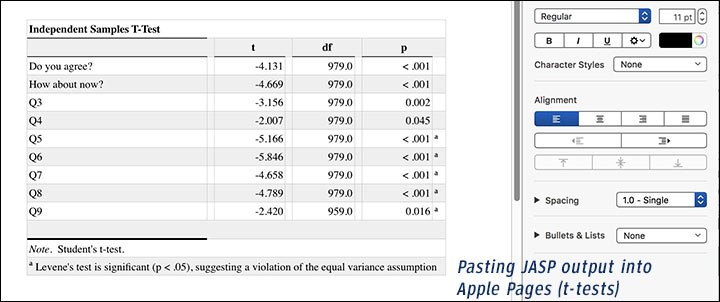
The software looks and feels like SPSS to a degree; it feels as native as SPSS. Calculations and screen drawing are far, far, far faster than in “real SPSS” — when you select the tests, they might actually be pumped out before your finger is fully off the mouse. Stepwise regression is now supported. When you do t-tests, if equal variances are not present, it only prints out a warning, and you must switch to Welch’s t-test instead of using the dual-variances formula of the classic Student’s t-test (you can specifiy printing both); it does not apply Welch’s t-test automatically, nor is printing descriptives the default. The format for multiple t-tests is quite neat.
We loaded our large test file instantly, and ran descriptives instantly. Survey researchers will be happy to know they can assign value labels — and unhappy to know they must be done variable by variable, without syntax. Labels are retroactively applied to the output window. Variable labels are not supported on import (though descriptions are now allowed)—nor is there a good way to compute new variables. The method they suggest is exporting data, making the changes, and bringing it back again (losing any value labels, presumably).
Other issues include lack of support for date or time variables; and no ability to direct output to new variables. t-tests require two-value group variables—you can't pick, say, Dodge vs Chrysler from a list of automotive brands; you have to create a new variable consisting solely of Dodge and Chrysler, which is a nuisance. Variable lists work in alphabetical order and don't show labels, so variable names have to be chosen carefully.
JASP is under rapid development. The speed is quite good. You can set the resolution of charts, so you can copy them at 300 dpi if you want.
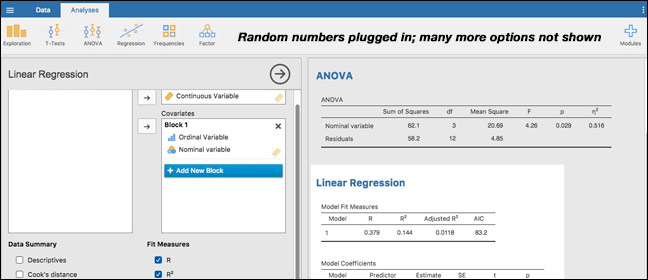
JASP’s advantage over Jamovi is that it supports forward, backward, and stepwise regression, while Jamovi only supports "Enter;” JASP has niftier menus and nicer output; an integrated R syntax plugin; and Bayesian statistics up the wazoo. Jamovi does have its own advantages...see below.
There is a great deal of documentation in the newish book Learning Statistics with JASP. There is also a Machine Learning module.
In our run-throughs, the numbers were identical to SPSS, PSPP, and Jamovi.
Dive more deeply into JASP (full MacStats review).
Jamovi: deceptively powerful
Current Version: 2.5
Listing updated: 4/5/2024; program updated recently (updates are roughly once a month)
See the an online “cloud” version
Cryptographically signed by Apple
378MB download, 976MB in place
Jamovi: A free, open source package, built atop R (Thanks, Dr. Kim-Oliver Tietze). Jamovi uses a spreadsheet interface with full graphics, and allows both syntax and menus. You can edit via spreadsheet or internally; and your data, analyses, and options are saved in a single file, so others can reproduce your work. A large number of analyses are easy to find.
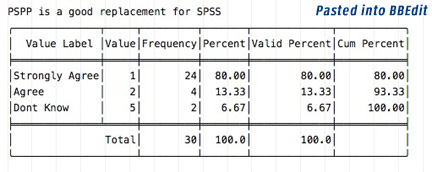
The results are attractive (see above), with menus that will be familiar to any SPSS users and with many options. Copying and pasting output is cleverly done; right-click on a section of output, and you can paste it into Word as a nicely formatted table. Paste into BBEdit, and it will be plain-text, formatted with spaces. There are three built in plot themes.
The online (cloud) version is also very responsive.
Syntax mode shows the R syntax for each menu command, helping you to learn it or to make scripts to reproduce the same actions over and over, ... except for importing data. Data can be imported in numerous ways, including SPSS, SAS, and Stata files. When we imported an SPSS file, value labels came through, but it does not support variable labels at all. Likewise, it did not export variable labels consistently. Export from Jamovi to SPSS resulted in errors on some data files as the number of characters in some fields was not correctly marked.
Shortcomings. Jamovi is fairly fast, but (like PSPP) doesn’t fully use the Mac interface; pretty much everything is instant, while on SPSS it takes a long time for windows to form and disappear. If you click on "Browse" in the file open/close menu, you do get access to the native file selection system.
Jamovi’s menus are kept within its own window instead of at the top of the screen, and the open/save dialogue box is very different, though it does show shortcuts for the documents, downloads, desktop, and home folders (it also has the odd new Microsoft approach to open/save/print, creating a whole new window/interface for it). You can, however, drag and drop data files onto it — saving time.
Variable names have to be fixed up before importing data, because the variable lists work in alphabetical order and don't show labels.
For ideological reasons, you only get Enter for linear regression. You can however do multiple blocks which is at least better than PSPP if not up to JASP. Regression allows easy entry of factors and weights.
If you do a student’s t-test on groups with different variances, it prints a warning rather than using the alternate formula; at this point you must to switch to Welch’s test (it would be nice if descriptives were standard). t-tests require two-value variables (you can't pick, say, Dodge vs Chrysler from a list of automotive brands; you have to create a new variable consisting solely of Dodge and Chrysler), which is a nuisance, especially given the painful interface for recoding. This is the same as in JASP.
Other issues include no support for date or time variables; and no ability to direct output to new variables. You can’t copy and paste from BBedit into Jamovi, but must use its clunky though powerful data transformation system. The program is almost quite large on disk, due to the integrated software — R, Electron, Mantle, Python, and ReactiveCoca.
Other notes. Developer Jonathon Love pointed us to the Jamovi library of extra procedures. A long, well-illustrated Jamovi blog post also goes over the fine graphics capabilities within Jamovi, which PSPP can only dream of. In our run-throughs, the numbers were identical to SPSS, PSPP, and JASP.
Dive more deeply into Jamovi (full MacStats review).
Other free general statistics software
Past 4 (PAleontological STatistics): an absurdly wide-ranging, easy to use package
Current Version: 4.11
Listing updated: 6/28/2023 (program updated August 2022)
64-bit and Catalina capable
Signed by Apple (App store version)
“Past is free software for scientific data analysis, with functions for data manipulation, plotting, univariate and multivariate statistics, ecological analysis, time series and spatial analysis, morphometrics and stratigraphy.” That said, Dennis Helsel wrote, “While its name shows its origin (Paleontology), it is a full-fledged stat package which includes multivariate and permutation tests, with a nice interface.” There is good support for geographical and map-based statistics.
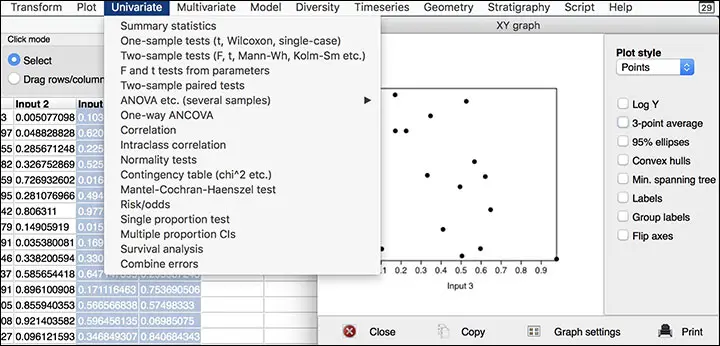
When Dennis says “full-fledged,” he isn’t kidding — the range of this software is stunning. Yet, the download is a mere 10 MB — far, far, far less than many others. What’s more, every new version brings a wide range of new features—even 0.0x versions. Summary statistics came in a fraction of a second on a laptop. Our survey file never caused more than a slight pause.
Downsides. Import formats are limited and exclude SPSS and Excel files; some rather esoteric formats are accepted, though, and you can copy and paste from Excel (with caution). Large files (e.g. 40,000 cases) can choke it. There are no value labels, but there are variable levels (click Column Attributes and you can enter variable names) and there is scripting.
You can transform data but without the flexibility of some other software; you cannot set missing values. Transformations tend to the complex, leaving out the simple. The "select data and then operate on it” format is clunky; and if you choose columns rather than specific data groups, the program essentially freezes trying to deal with a huge number of cases. There is no way to do independent-sample t-tests by having one variable define groups; you need to have each group in a different column, and only select the data you want to analyze.
Overall, Past is excellent for some of its features but people who don’t need its unique properties are better off with the others listed here. Most recently (3/20/23) I tried to import data and it simply froze.
Dive more deeply into PAST (full MacStats review).
Regress+
Current Version: 2.8 (updated May 2019; prior version was dated May 2017)
Listing updated: 6/28/2023
64-bit, signed, works well in Mojave
Michael McLaughlin’s Regress+ is a free package that includes regression, stochastic modeling, bootstrapping and robust goodness of fit measures. The software and a tutorial are available at the Regress+ web site. Older versions are still available for older operation systems, while version 2.5 is available for OS X and 9.2.
The program is accompanied by full documentation in PDF form which doubles as a statistics reference guide.
Regress+ 2.7, née Regress+ 3.0, was a complete rewrite; it added data modeling (equations and distributions), extensive documentation, and publication quality graphics. Regress+ 2.8 was a substantial upgrade.
This program appears to cover every aspect of regression you can think of. It's graphically oriented but has strong statistics. The code is “more than 100 times faster than before [2.7].” It is somewhat neglected in favor of MacMCMC, a Bayseian program, but is still up to date enough if you don’t have a newer (M1, M2, M3) Mac.
A somewhat steeper learning curve or tougher install
R (CRAN) / “R for Mac OS X” / R.App and R GUI
Current Version: 3.6; under active development
Signed, 64-bit, requires XQuartz
Listing updated 6/2023; software updated 6/2023
This is an exceedingly flexible program, with a large number of libraries and built in routines, and the ability to run many S or S-Plus programs. R loads and runs quickly but has a steep learning curve.
R programs and algorithms are distributed by the Comprehensive R Archive Network (CRAN). A simple and somewhat frustrating graphic user interface is included for Mac users; R Commander can be installed using the built-in package installer, which can also install file import features (which aren't installed by default). R Commander is an X11 program, which means it uses an alien interface and has odd open/save dialogues, but if you get past that it offers menu driven commands not dissimilar from, say, SPSS, just a lot more awkward to use, and without an output or data window.
There are now numerous front ends for R, several of which are mentioned earlier on this page.
R has a massive range of tests, PDF and PostScript output, a function to expand zip archives, and numerous other unexpected features. For much more information about R, including advantages, drawbacks, resources, and tips, see our incredibly outdated R statistics software for the Mac page.
R Studio
Current Version: 2023.01
Listing updated: 6/25/2023; program updated ? (Hard to figure this out)
Basic version free; non-basic versions thousands of dollars per year
Signed by Apple
R Studio is commercial open-source software, designed for creating and managing R applications rather than, say, doing exploratory research or testing the odd hypothesis. With frills, it can get expensive, but without frills, it’s free. It’s 500MB plus R itself at around 130MB, and requires a separate R download; R itself is updated regularly and has a signed Mac package.
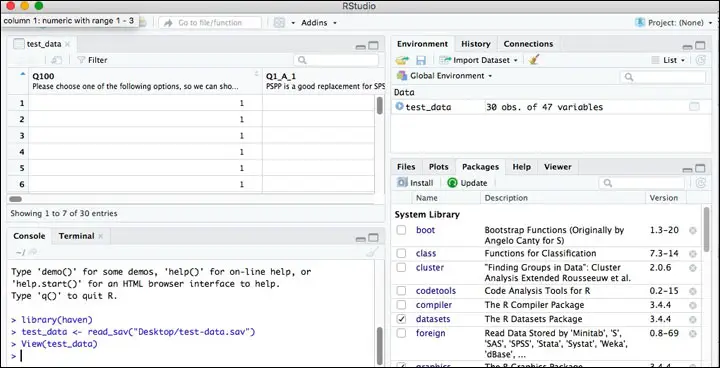
When you first load R Studio, it tells you to go back and install R. Once you've done that and restarted, it finds R easily enough, and presents you with an integrated development environment (IDE). If you try to do something, such as importing SPSS data, that isn’t possible without further downloads, it automatically connects to the Internet and installs whatever you need. The user interface is Mac-standard in most ways — you get a menu at the top of the screen (as well as menus in the window itself), and the open/save dialogues are thankfully quite normal.
Though you can manage your R installation from R Studio, it’s a tool for dealing directly with syntax, and for managing projects; it’s not a beginner’s tool (as, say, Jamovi can be). R Studio never claims to be anything but an IDE, with many options and good operating-system integration.
SageMath
64-bit compatible
Current Version: 9.5
Listing updated: 2/16/2022 • Program updated 2022
Size: 3.5 GB (yes, GB)
SageMath is not specifically for statistics; it’s general math software, but it has the ability to do numerous statistical processes including graphing/plotting. It can be used for just about any type of math, and can be used either with the command line or or from a web browser. You can install it onto a server if you want, and create embedded graphics, typset-style math expressions, and more; it also includes sharing. The program was designed for both education and research. It is not a typical Mac program; it has a command line element and is accessed from browsers.
SageMath was built atop existing packages including NumPy, SciPy, matplotlib, Sympy, Maxima, GAP, FLINT, and R.
Specialty tools
MacMCMC
Current Version: 1.6
Listing updated: 12/2023 (program updated 12/2022)
Signed, 64-bit; good for El Capitan “or later”
Currently just 20 MB
From the writer of Regress+ comes a free, powerful program to analyze any kind of data. MacMCMC is part of a two-part set—the other part being a free ebook. Data can be imported from plain text (UTF-8). There are 27 built-in distributions, including 16 continuous, 8 discrete, and three homogeneous mixtures — Normal, Bivariate Normal, and Poisson; users can also define their own distributions. There are 15 built-in functions. Reports include MAP, mean, median, mode, and Gelman-Rubin; credible intervals; trace; plots of marginals; and trace comparison for selected chains. The program has other features, described on its web site, along with a sample input, data, model, and output.
Advantages of MacMCMC, in addition to its price, include being a complete standalone Mac program (hence its small size and fast operation); 100% Bayesian inference; parallel processing; and access to low-level options. Users can check for updates from a dropdown menu. The basic method of using the program is to set up the model via a simple text format, easily figured out from the examples or the ebook; load data (in ASCII format); run Compile, run Setup, change any parameters desired, and then run. That yields a plain-text report and a graph which can be adjusted as needed.
G*Power
Current Version: 3.194 / requires OS 10.7-10.13
Older versions: 680x0; PowerPC; OS X (Universal Binary); Windows and DOS
Listing updated: 8/2019 (program updated Feb, 2019)
Signed, 64-bit; no mention of Mojave
G*Power was developed by Axel Buchner to provide power analyses for the most common statistical tests in behavioral research: t-tests, F-tests (including ANOVA, regression, etc.), and Chi-squared tests. G*Power computes power values for sample sizes, effect sizes, and alpha levels; sample sizes for given effect sizes, alpha levels, and power values; and alpha and beta values for given sample sizes, effect sizes, and beta/alpha ratios. It is a remarkably small program, just over 2 MB in size. Updates (for both Mac and Windows) are slow, with nothing but bug-fixes since March 10, 2014. Version 3.1 itself dates back to 2009, though there were numerous improvements from 2009 to 2014.
gretl
gretl can do general statistical routines and many specialized ones; it is in our “special purpose and general math programs” page.
GMT (“The Generic Mapping Tools”)
![]() Current version: 5.45
Current version: 5.45
Program updated: Jan 4, 2019
Listing updated: 9-2-2019
Command-line tools that run on Unix-like systems, including Mac OS X. See https://github.com/GenericMappingTools/gmt for details. Many of the main developers, including Paul Wessel, use Mac OS X. From their site, GMT is...
... about 80 command-line tools for manipulating geographic and Cartesian data sets (including filtering, trend fitting, gridding, projecting, etc.) and producing PostScript illustrations ... [up] to artificially illuminated surfaces and 3D perspective views; GMT supplements add another 40 more specialized and discipline-specific tools. GMT supports over 30 map projections and transformations ... [and] is developed and maintained by Paul Wessel, Walter H. F. Smith, Remko Scharroo, Joaquim Luis and Florian Wobbe, with help from a global set of volunteers, and is supported by the National Science Foundation.
gnuplot
![]() Configurations: PPC (older versions), Intel (current)
Configurations: PPC (older versions), Intel (current)
Current Version: 4.6.3
Listing updated: 7-7-13
Program updated: 4-18-13
gnuplot is open source scientific plotting software. It is available online from many sources
OpenEpi
Current Version: 2.2.1
Last update: 4-6-2013
Listing updated: 4-24-2018
![]() Kevin Sullivan’s open source OpenEpi software is available in four languages; unlike most software, it can be run from a web server or on a regular computer. The programs are written in Javascript and html and should be compatible with Macs and Linux and Windows machines. Test results are provided for each module to allow people to check reliability of their own setup. The software is set up for epidemiology and has numerous key statistics for that field, along with the usual means, medians, t-tests, ANOVAs, powers, etc.
Kevin Sullivan’s open source OpenEpi software is available in four languages; unlike most software, it can be run from a web server or on a regular computer. The programs are written in Javascript and html and should be compatible with Macs and Linux and Windows machines. Test results are provided for each module to allow people to check reliability of their own setup. The software is set up for epidemiology and has numerous key statistics for that field, along with the usual means, medians, t-tests, ANOVAs, powers, etc.
StatCrunch (now from Pearson)
StatCrunch is a freely available for web-based use, currently without advertisements, with a $5 per user fee for use on your own server, or $5/six months. It has the usual range of basic statistics, from t-tests to regression to ANOVA and nonparametric tests, with a wide range of graphs also available, and works from Excel or text files. StatCrunch will also store your data within reason. For those with low budgets or infrequent needs, StatCrunch's fairly easy to use interface and price are extremely attractive (it also makes sharing data easy).
Geographic resources
 GRASS
GRASS
Configurations Available: Mac, Linux, Windows
Price: Free (and open source)
Current Version: 7.8.5 / 8.0 Preview
Listing updated 10-3-2021
Last software update, 12-21-2020
Michael Barton pointed out that GRASS is used for geographic resources data management, image processing, graphics production, spatial modelling, and visualization of many types of data. It is an official project of the Open Source Geospatial Foundation.
Originally developed by the Army as a tool for land management and environmental planning, GRASS is a powerful utility with a wide range of applications in many different ares of scientific research. GRASS is currently used in academic, government, and commercial settings. Attributes are managed in a SQL-based DBMS.
GRASS 6 added a new topological 2D/3D vector engine and support for vector network analysis. A new display manager has been implemented. The NVIZ visualization tool was enhanced to display 3D vector data and voxel volumes. Messages are partially translated with support for FreeType fonts, including multibyte Asian characters. New LOCATIONs can be auto-generated by EPSG code number. GRASS is integrated with GDAL/OGR libraries to support an extensive range of raster and vector formats, including OGC-conformal Simple Features.
Quantum GIS
Configurations Available: Mac, Linux, Windows
Current version: 3.20
Price: Free (and open source)
Signed for newer Mac versions
Listing updated 10-3-2021; last release, 9-10-2021
Quantum GIS is a somewhat less powerful but easy to use GIS package for Mac, Linux, and Windows. It is also an Open Source Geospatial Foundation project, and it supports numerous vector, raster, and database formats and functions.
Generic Mapping Tools (GMT) for geographic data
Configurations Available: Mac (under X11), Linux, UNIX, OS/2, Windows [requires Cygwin or VirtualBox for full function]
Current Version: 6.2.1 (released June 2021)
Price: Free (and open source)
Listing updated 10-3-2021
Generic Mapping Tools, or GMT, is an open source collection of many tools for manipulating geographic and Cartesian data sets (including filtering, trend fitting, gridding, projecting, etc.) and producing Encapsulated PostScript File (EPS) illustrations ranging from simple x-y plots via contour maps to artificially illuminated surfaces and 3-D perspective views. A MATLAB extension is available.
Libraries
Matplotlib
Free - open source - for Mac OS X
Current version: 1.2.1
Report updated: 7/2013
![]() Matplotlib is a pure python plotting library with the goal of making publication quality plots using a syntax familiar to matlab users. The library uses Numeric for handling large data sets and supports a variety of output backend.
Matplotlib is a pure python plotting library with the goal of making publication quality plots using a syntax familiar to matlab users. The library uses Numeric for handling large data sets and supports a variety of output backend.
On August 28 2012, John D. Hunter, the creator of matplotlib, died from complications arising from cancer treatment, after a brief but intense battle with this terrible illness. Please consider making a donation to the John Hunter Memorial Fund.
SciPy
![]() SciPy is a library of scientific tools for Python which supplements the Numeric module. SciPy includes modules for graphics and plotting, optimization, integration, special functions, signal and image processing, genetic algorithms, ODE solvers, and others.
SciPy is a library of scientific tools for Python which supplements the Numeric module. SciPy includes modules for graphics and plotting, optimization, integration, special functions, signal and image processing, genetic algorithms, ODE solvers, and others.
VTK (Visualization Toolkit)
May be compiled from source code for OS X, Linux, etc
Latest version: 7.1
Listing updated 1/2017
![]() The Visualization ToolKit (VTK) is a system for 3D computer graphics, image processing, and visualization with several interface layers. In VTK applications can be written directly in C++, Tcl, Java, or Python.
The Visualization ToolKit (VTK) is a system for 3D computer graphics, image processing, and visualization with several interface layers. In VTK applications can be written directly in C++, Tcl, Java, or Python.
“VTK supports a wide variety of visualization algorithms including scalar, vector, tensor, texture, and volumetric methods; and advanced modeling techniques like implicit modelling, polygon reduction, mesh smoothing, cutting, contouring, and Delaunay triangulation. Moreover, we have directly integrated dozens of imaging algorithms into the system so you can mix 2D imaging / 3D graphics algorithms and data.”
Also see:
- Graphing and visualization software (including packages that do statistical routines, e.g. Aabel)
- Commercial software
- Dead software
About our test survey file
Our test survey file: The “survey file” has 1,000 cases, with 40 questions on a five-point scale, two irrelevant variables (screen width and height), and a couple of demographics (shown here as “job type” and “new or old hire”). We are planning to run the same tests on each package as time goes on.
Sponsored by Toolpack Consulting
Copyright © 2005-2024 Zatz LLC. All rights reserved. Created in 1996 by Dr. Joel West; maintained since 2005 by Dr. David Zatz. Contact us. Terms/Privacy. Books by the MacStats maintainer