
See our starting guide to using SPSS statistics software
Recently, we spent around a month with SPSS 27, largely using it to film instructional videos.
SPSS was the industry standard statistics package when it was purchased by IBM; then price was jacked up, before it was converted to a subscription. Many features still require expensive add-ons. The Java-based user interface is absurdly slow, especially when opening windows; there are many free programs that leave SPSS in the dust (JASP and JAMOVI do so while using the highly reputable R as their back end). Still, nothing is as flexible and powerful as SPSS.
SPSS Mac easily exchanges data, syntax, and output files with the Windows version, and with most older versions (even those which can’t deal with long variable names). Output file formats changed a few years ago, but can be read in the free PSPP if needed. The syntax and data files are also readable in PSPP.
The changes since 17—really, since 11—have been incremental. The software looks better, but is slower. The output is formatted almost the same as in version 17.
One addition is an AI-assisted version of linear regression used for modeling; it is now the default, and it has snazzy graphics you should not need (if you're doing regression at all!), and might make some assumptions you do not want to make. Mainly, it removes outliers automatically, and that might or might not be valid. We can see how this would be a time-saver while also seeing how its automatically doing things that normally require judgement can be a real problem.
Because SPSS 17 and 27 are so similar—the changes were almost entirely adding new features—rather than writing a completely new page, we’re providing a bit of SPSS 27 introduction and then going back to 17, noting where times have changed. If you want to see what has changed version to version, see the SPSS site. If you have an old version and it is still working, there’s little reason to upgrade.
SPSS 17 is very similar in most ways to SPSS 16, only with far fewer bugs and with some key additions. The program is still slow, which is almost entirely due to the speed of rendering results, rather than speed of calculation.
SPSS still does not have keyboard commands to switch through the various windows. You can shut off the case summary, but you have to do it at the beginning of each session (in 27 this is a permanent option). The mainly-useless Help menu still runs through every single menu when clicked, a major slowdown (fixed somewhere before 27); SPSS believes the problem is in Apple’s Java implementation.
It is hard to read variable names in most dialogue boxes; but you can usually drag on the side of the box to enlarge it, and then more of the variable name comes into view. It stretches the entire box, though - you can't change just one element, and you still (in 27) can't switch from variable labels to variable names within the box.
SPSS 17 and 27 read older data and syntax files with no problem; more impressively, older versions of SPSS can easily read SPSS 17’s files, even though SPSS 16 and up have support for long variable names. Output files are an exception there; the format changed around SPSS 16.
Neat additions for 17 were a codebook procedure, which records all sorts of information about the data file; an improved syntax editor with autocompletion of common commands, code coloring, and instant reporting of errors in the syntax window; and spell checking of text strings in the data file (especially handy now that strings can be well over 256 characters — you can now use SPSS to handle qualitative survey data). An export-to-Office feature provides more control over the output, too.
As a side note, if you need to read SPSS “SPV” output files from relatively recent versions, you don’t need SPSS or even the company’s slow, buggy SmartViewer. You can open them in the free PSPP—very quickly indeed.
 SPSS is one of the big statistical dogs of business and science; in particular SPSS' focus on business makes it relatively easy for the beginner, whether they plan to use it for scientific analysis or market research. Unfortunately, after its first promising version (which leapfrogged the old SPSS/PC), the Mac was relegated to second class or worse at SPSS; not until recently did the company start having MacKiev work on usable ports of the Windows versions. Even more recently, SPSS chose to take non-Windows platforms much more seriously, setting up a core statistics engine which is addressed by Java front end. This setup lets SPSS customize the front end for each platform while offering similar features across the board, without some of the limitations (particularly the time delays) of the past.
SPSS is serious, industrial-strength software; though it can be used through a familiar interface, with a spreadsheet view of the data and dropdown menus to run analyses, real power users eschew these and go for the built-in syntax language. SPSS has menu access to most or all commands, batch-language and interactive-command control, the ability to click a button and have a menu command appear in your batch file (so you will know how to write it in the future), and separate windows for syntax, data, and output. You can assign labels to values (1="Strongly Agree") and to variables (DOD1942 = "Department of Defense Document 1942 references within this file").
Mac versions still have some interchange issues with Windows versions; Mac support is hard to find on the SPSS site; and there appear to be some Mac-specific bugs. On the lighter side, the current version comes with regression included, instead of being part of the Advanced Models package; but the tables facilities are still an option, as are time-series and numerous other statistics. Also to SPSS’ credit, the Mac version puts the menu at the top of the screen, has standard open/save dialogues with bookmarks on the left, and other user interface conventions of the Mac world.
The price remains very high for individual commercial users, and on top of the steep cost for the base package, many users will need extra modules, each of which costs about as much as a low-end version of Stata – and SPSS charges for module upgrades, too. However, academic prices are substantially discounted even for single users; there are dramatically discounted “graduate packs” and "starter packs" good for four years; and academic site licenses which can greatly lower the price if you’re at an institution that buys many copies.
Stata’s full version is usually priced well below SPSS’ base package; but Stata has some drawbacks, including much lower ease of use, lack of “camera ready copy” — such as it is in SPSS — and some missing features, such as an easy way to do stepwise regression; and the spreadsheet view is lacking in comparison with SPSS. Stata does have a vibrant user community, but then, so does SPSS; both allow the use of external algorithsm, in SPSS’ case accepting both Python and R. To use them, you have to install the free Programmability extension.
One handy feature of SPSS is a sort of variable spreadsheet, which makes it easy to find and manipulate each variable. The columns shown below can be widened or narrowed as needed; and some items (such as value labels and missing values) can be copied from one variable and pasted to others. One can also change variable types here (indeed, this is the only place for doing that easily); but it's easier to change formatting (width, decimals, and columns) from syntax. Likewise, missing values, value labels, and variable labels can all be set either way, but syntax is easier.
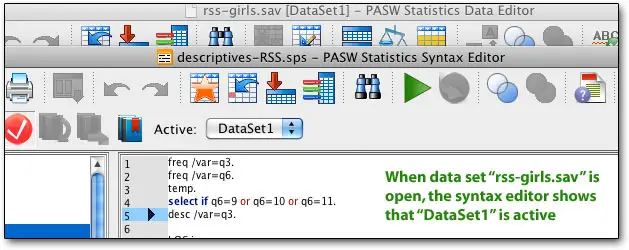
A new, and surprisingly handy, feature is the ability to have more than one dataset open at a time.
The “measure” column is new, and lets one declare the type of variable, which can be handy in the variable selection views (shown later). Variable names can be longer than 8 characters now but spaces and many special characters are still not allowed; fortunately variable labels are also available.
New users don't have to learn the syntax immediately; they can play around in the menus and submenus. Sometimes it’s a little awkward — in the example below, poorly chosen variable labels (automatically added by Perseus SurveySolutions) overfill their space, and the components of the box cannot be resized. Instead, as you move the mouse over, the full name floats over, after a substantial delay; this feature tends to get in the way more than anything else. The new use of icons is handy, though — you can quickly see which variables are appropriate in a particular analysis, if you took the time to mark them correctly. Even if you didn't, you can see the string variables easily.
For the average SPSS user, who will use a relatively small number of procedures repeatedly, the Paste button is invaluable. Instead of going to the manual immediately, the user can set all the options in this and the sub-windows, and then click on Paste. The command will then appear in the syntax window, to be re-used later, perhaps with different settings, or perhaps just with different variables. This is the easiest way to learn the syntax (though it helps to have the manual as well, to see what each setting does, and in case there are syntax commands not available through the GUI.)
As with prior versions, as you can easily slice, dice, and weight data, and pop out scatterplots using the built-in menus, SPSS automatically records your syntax into a “journal,” which you can later modify to quickly run lots of analyses very quickly. We recommend you use the syntax guide (provided on CD, or at extra cost in book form) and type your commands as often as you can, instead of using the menus. Using SPSS becomes much, much faster that way, especially if you tend to use powerful tools such as "temp/select if" and "do if" commands for quickly selecting one or two groups. Writing little programs in the syntax mode can save a great deal of time, and separates professional programs like SPSS from software which fills the needs of more casual reseachers. (The free, open-source R project only uses syntax.)
By typing in commands and then running them as a batch, the researcher can both take advantage of commands that don't work well as menus - such as temporary / select if - and save frequently used routines. For example, when running a linkage analysis to link employee survey data to customer or financial outcomes, I tend to run a number of regressions. It's far faster for me to type these commands in than to repeatedly trek through the menus. Likewise, if I just want to see how employees in Kansas answered a given question, I can either go through the menus, select just employees in Kansas, and select a frequency count; or I can type...
TEMP.
SELECT IF LOCATION=4.
FREQ /VAR=Q4.
Though it takes some time to learn the commands, most people tend to use the same commands over and over again. Using syntax can also save a lot of time for people who frequently use different options than the defaults. While the menus aren't too clumsy, simply typing the commands is a major timesaver.
SPSS has done a wonderful job of maintaining the syntax through all Mac and Windows versions, so that files written for older versions work without a hitch. The data format is also compatible without conversion, across versions and platforms, making it easy to share data and scripts with Windows people or users of older Macs. Data is stored in a highly compressed format, in a break from Microsoft norms of oversized files (but matching SPSS' mainframe heritage). There can be problems with sharing output files.
SPSS 16 seems less “touchy” than prior versions, though it is very sensitive to license issues. Activation is required, and we had times when it stuttered and told us there were licensing issues. That said, the program starts up quickly; selecting a data file is easy, though getting a new Excel or other data file in requires going into Open and then adjusting the file filter (otherwise it only opens SPSS’ own tightly-compressed .sav files).
Numerous icons provide little ease-of-use features, including variable sets, a lit of variables, a Python scripting facility, an easily used “common commands” button, and an export button which allows the output to be exported directly to Word, Excel, PDF, html, plain-text, or (just for graphics) various graphics formats like JPG and GIF.
A new “identify duplicate cases” feature will be quite a boon to survey users; it’s a fairly flexible tool, too. The menus and toolbars can finally be customized, which can help speed up the daily routine. A “visual binning” tool makes it easier to sort out the variables into categories (scale, ordinal, etc.), and another tool allows for date identification, another very useful new feature; the multiple response categories tool was already available and handy for surveyors. Insane people can change the user interface from “Macintosh” to “SPSS standard” so they can experience the joys of seeing three different menus, one on each window, and each one containing different commands.
It used to be that SPSS would run its analyses, then put them into the SPSS Viewer window (there are three windows at most — Viewer, where output goes; Syntax, where you program or run commands one at a time; and the variables/data spreadsheet), but now SPSS sets up the output window, putting in placeholders until it builds the tables. It’s just a little weird but no better or worse. Speed seems about the same — the calculations are lightning fast, and the graphics take a while. Every analysis seems to get a little header that we usually delete, telling the valid and missing sample sizes in summary form, even if they're in the regular output. We thought this could not be shut off, but the people from SPSS corrected us — you can shut it off, using the Output Management System. Indeed, the output management options are fairly extensive and allowed us to shut off repetition of commands, warnings, and other items — it’s a real improvement.
Copying and pasting is easy when it works; copied tables are pasted as ordinary text in programs like Dreamweaver, as tables in Word, and as data in appropriate cells in Word. If you want to retain the formatting, paste into Word; if you want to manipulate the results, Excel. Some larger output tables simply would not be copied at all, but you can save the output window and get at it that way. This is a real improvement over the prior version, which required us to paste into BBEdit before pasting into Word. On the darker side, we weren’t able to copy multiple output tables at once, which would have saved time. Users who want to customize the output will still be frustrated.
Charting is far better than in the past; though creating charts is a fairly clunky process in some ways, charts come out with sensible, clear formatting, are incredibly editable, and provide numerous options for scientists, statisticians, quality folk, and ordinary people. What’s more, the system pumps out the syntax whether you asked for it or not, so you can make minor changes manually without going through it. A test with fake data is:
Pivoting trays make it easy to change the way tables are printed; rows can become columns, for example, and layers can be made into rows or columns very easily. Anything can be switched to another place. Only a few commands (including REPORTS and LIST CASES) still produce old-fashioned, space-formatted, typewriter-font output. Since the REPORTS command is very useful, we hope they get around to converting all the commands to clean, tab-delimited output.
Charts, like tables, can be customized, and various formatting options can be saved as a chart style. The ability to save chart formats and to specify some options in syntax helps.
SPSS 11, like prior versions, also reads tab-delimited and fixed-format ASCII text and Excel files. Output files can be saved as html for posting on the Web. SPSS also sells programs which allow other people to view the results and delve deeper into the data. Dividing and subdividing data sets is fairly easy with commands such as Split File and extensive reporting features. Split File lets you sort results by a variable (or several variables) - for example, running any test or description separately on each location in a survey, using a single command. This can be a real time-saver.
New for SPSS is a very useful feature: string variables beyond 256 characters, allowing for easier use with survey data.
The optional and very handy Reports module produces output with tab-delimited tables , but it’s still only camera-ready if you’re not very particular. The Reports module can save a great deal of time when, for example, analyzing survey data. Most people will probably export (usually via copy and paste) SPSS tables and charts to other programs for publication.
Bertolt Meyer, in his weblog, pointed to numerous SPSS 16 bugs, which the SPSS people claim have been fixed in 16.01 and 16.02. We found that value labels were converted into nonsense; and trying to run a large block of syntax created in text-editor BBEdit - all in U.S. English - resulted in the curious message, “Text value unmappable in the current server local” (and no pasting). Likewise, saving the syntax file gave us "Text will be lost when the file is converted to the local encoding. Save anyway?” (BBEdit is not an SPSS product, but ideally every program should work with every other program.)
Here are some more issues that persist in 16.0.2:
There are reportedly also bugs regarding changes not being recorded when large files are saved.
This is not a bug per se, but after all these years, one would think that SPSS would make it easy to call up the data, dictionary, and output windows by using keyboard commands, at least when there is just one of each. Another annoying non-bug is the unavoidable printing of a case summary each time you do something - there’s just no way to shut if off.
A new oddity is running through all its commands (if the status window is to be believed) each and every time the mainly-useless Help menu is clicked. This continues after the 16.0.2 update.
You can now change the size of dialogue boxes, so that if you want to see longer variable names in, say, Recode, you can - but you can't change the size of any particular element, resulting in some serious stretching at times.
Michael Karcher noted that SPSS 16 cannot read old .spo (output) files from either platform; we were able to verify this (the Windows version also cannot read spo files, but Windows users get a free reader for older versions; Mac users do not). SPSS 16 does read old data files from as far back as SPSS 10, and probably earlier, without issues, and old syntax files are no problem.
SPSS 16 is sluggish on any PowerPC machine, including the speedy G5; SPSS appears to run around twice as fast on an Intel laptop as on a faster G5 workstation. On a Mac Pro, the user interface ran fairly nicely, though we have yet to compare it to SPSS 4.0 on an 8 MHz Mac Plus; however, at times calculations were surprisingly sluggish, including simple frequencies and crosstabs.
One reader wrote in: “I guess it is also fair to mention that given all of the SPSS patch notifications I have been getting for the past year from SPSS regarding data that doesn't save and changes that go unrecorded in large files, I have really lost a lot of faith in the new version.” [SPSS has had a 16.01 patch for at least two weeks for Windows but did not even mention the Mac version on their upgrade site, as of April 8, 2008. By the end of April, the Mac patches, including 16.02, were posted.]
Speed did not change when we added Java 6 to our system.
As a final note, many of these problems may be resolved in SPSS 17, which may not be a satisfactory solution for those who have to pay for their updates — but SPSS is “coming soon,” so we’d suggest waiting for its release if you’re on the verge of buying.
SPSS is sold as a base program with optional modules, all of which are available for the Mac. Between the base program and the modules, a huge number of analyses, tests, and statistics can be generated, most of them with ease. The company's Web site provides details on what each module does, an important consideration before buying. (When upgrading, the user must pay for upgrades on each module they use as well as on the base program). Some specialized statistics, however, can only be generated using non-SPSS software which is sold in other packages by SPSS (for example, a new program for dealing with very small samples).
Given the breadth of SPSS, it is nearly impossible to go into any depth on its statistical features. However, we can generally say that its statistical range is comprehensive, and that it becomes easier to use as one gets used to the syntax. The program works well with Excel, and is flexible in many ways.
The latest SPSS reinforced our conclusion that Stata is for scientists and statisticians – people who work the numbers for their own use, and only rarely take numbers out of the program for publication; but who need an additional level of flexibility, to the point of being able to program in their own specific routines. Getting Stata to do a new (to the user) procedure could be a rough task, with a steep learning curve and many alternative ways of doing things. These problems have to be weighed against speed, an exceedingly responsive tech support group, better pricing, and a historical commitment to cross-platform software.
Unfortunately, SPSS’ ease of use is severely marred by a feeling that the current version was only briefly beta-tested. That said, the numbers are probably as accurate as ever; an SPSS engineer assured us that while the user interface was new, the calculations were handled by the same engines used in the past, which can ram through incredible numbers of operations with great accuracy and speed (even if the output window draws the results slowly).
In the past, we generally believed the price of SPSS was well worth the ease of use — time is money, and spending days figuring out how to get basic features to operate quickly stops paying off. There is a penalty to pay for the Java user interface, at least for the moment; users of Mac Minis and older machines (particularly otherwise-demon-fast G5s) may be disappointed with some lag in the user interface. However, the program is easier to use and much, much more reliable than recent Mac versions, the numbers are (SPSS assures us) very accurate, and it’s still far faster to use even a sluggish SPSS than a fast Stata if you rely on the graphical user interface. SPSS is still the big dog of Macintosh statistical software.

Copyright © 2005-2026 Zatz LLC. All rights reserved. Created in 1996 by Dr. Joel West; maintained since 2005 by Dr. David Zatz. Contact us. Terms/Privacy. Books by the MacStats maintainer