
LinStats: free statistics software for Linux computers
Normally, MacStats only looks at, well, Macs. Some of the screen shots are taken from the Mac side as we set up this page...
It must be pointed out that it can be harder to install some software in Linux, because you often have to find a trusted repository that contains the target programs, and is updated properly, and actually works; simply downloading and running and installer is not as common as using package managers. As one example, in trying to install PSPP on Ubuntu, I found the instructions to be out of date and no longer valid (if they ever were); the only way to install it that I could find was downloading the source, and a compiler. Eventually I found a Debian repository that worked and was current, though the description was all in Spanish. Your choice may come down to what you can actually install and get running. Long-time Linux users may be able to negotiate these issues easily.
Free and promising general statistics software (in no particular order)
PSPP: Promising clone of SPSS
Current Version: 1.01 (depending on distribution)
Listing updated 4/26/2018
PSPP is a free SPSS clone that’s interoperable with OpenOffice, LibreOffice, and such — not that they’re required. It supports practically unlimited cases and variables, works quickly, and has an indexed users manual, which isn’t needed if you’re used to SPSS. There are official packages for the mainstream Linux distributions, or you can download and compile the source. In the end, it was easy to install via aptitude, from the terminal:
sudo apt-get install aptitude
sudo aptitude install pspp
PSPP is aimed at social scientists, business people, and students, with a convenient, easy to learn interface — which is similar to SPSS. It imports SPSS data files, long variable names, and variable and value labels. PSPP is much faster than SPSS itself; common options are included in some dialogue boxes without the need to dig deeper, another improvement over the original. Development seemed to accelerate in the last few years.
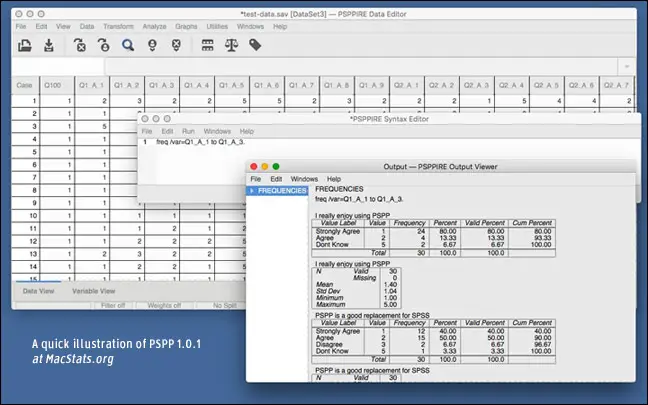
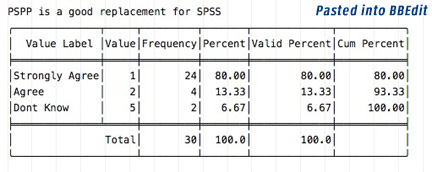
On the down side, there are fewer tests and functions than “real SPSS,” as you’d expect given its recent provenance. Also, while you can copy from the output window, you have to copy whole groups at a time (from the left-hand list, not from the main pane), and the output window copies plain-text, delimited by spaces and pipes, just as SPSS 4 did. That’s not ideal for importing to spreadsheets or word processors, unless you’re really, really good at using BBEdit’s GREP and macro features. There’s also no way to clear anything from the output window; the “recent files” feature doesn’t work; an error message comes up when you quit.
Our getting-started guide for SPSS is also helpful for getting started with PSPP.
However, the capabilities are impressive, including (but not limited to) graphing, data transformation, crosstabs, tables, various t-tests, ANOVA, regressions, factor analysis, ROC curves, and nonparametric tests.
Jamovi
Current Version: 0.8x (Mac, Windows, or Linux)
Listing updated: 4/2018; program updated 4/2018
Jamovi: A free, open source package, built on top of an R foundation (Thanks, Dr. Kim-Oliver Tietze). Don’t let that put you off: Jamovi uses a simple spreadsheet interface with full graphics, and while it allows you to use syntax, you can also use menus. You can edit via spreadsheet; and your data, analyses, and options are saved in a single file, so others can reproduce your work. A large number of analyses are easy to find, or you can use R syntax. Installation is easy from the terminal:
sudo add-apt-repository ppa:jonathon-love/jamovi
sudo apt update
sudo apt install jamovi
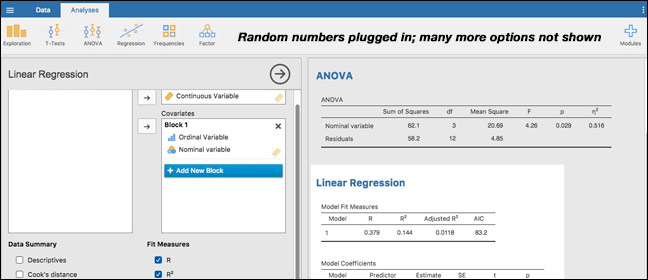
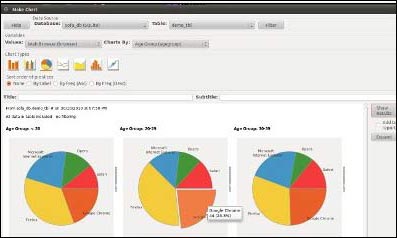
The results are attractive (see above), with menus that will be familiar to any SPSS users — and with many options. Copying and pasting output is cleverly done; right-click on a section of output, and you can paste it into Word as a nicely formatted table. Paste into BBEdit, and it will be plain-text, formatted with spaces. Plots can also be copied and pasted, but seem to be limited to screen resolution; there are three built in plot themes, including an SPSS-clone one.
A syntax mode shows the generated R syntax for each menu command, helping you to learn R syntax or make scripts to reproduce the same actions over and over, ... except for importing data. Data can be imported in numerous ways, including formatted SPSS files and, according to the programmers, SAS and Stata files. When we imported an SPSS file, variable labels came through, but not value labels.
Jamovi is fairly fast; and developer Jonathon Love pointed us to the Jamovi library of extra procedures, which makes it more useful for more people.
The program is a stunning 656 megabytes in size, due largely to the integrated software — R, Electron, Mantle, Python, and ReactiveCoca. We haven’t yet run it with our large sample dataset to compare results with other software, but since it’s based on R, it should be accurate and in line with other packages.
Dive more deeply into Jamovi on the Mac (full review).
JASP: making R more accessible
Current Version: 0.8x (requires OS 10.11+)
Listing updated: 4/2018; program updated 2/2018
JASP was created as “a low fat alternative to SPSS, a delicious alternative to R,” and comes out of the University of Amsterdam (presumably at lower cost than buying SPSS).
JASP is not yet at version 1 and may be used with caution; it also requires the free XQuartz window environment. It does use the native open/save dialogue box, surprisingly; and it’s easy to install, unlike, say, PSPP.
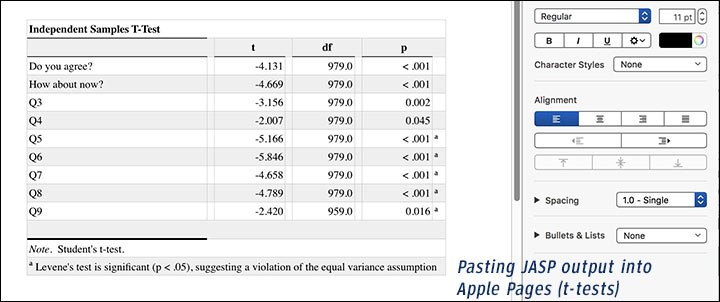
The software looks and feels like SPSS. Calculations and screen drawing are far, far, far faster than in “real SPSS” — when you select the tests, they might actually be pumped out before your finger is fully off the mouse.
We loaded our test file instantly — and ran descriptives instantly. Survey researchers will be happy to know they can assign value labels — and unhappy to know they must be done variable by variable, without syntax. The labels are retroactively applied to whatever is in the output window, very rapidly.
Dive more deeply into JASP (full MacStats review).
Other free general statistics software
MacAnova
Current Version: 5.05
Listing updated: 4-24-18
MacAnova is a free, noncommercial, interactive statistical analysis program developed by Gary Oehlert and Christopher Bingham of the University of Minnesota School of Statistics — and yes, there’s a Linux version! Their web site notes:
MacAnova has many capabilities but its strengths are analysis of variance and related models, matrix algebra, time series analysis (time and frequency domain), and (to a lesser extent) uni- and multi-variate exploratory statistics. MacAnova has a functional/command oriented interface. The Macintosh and Windows versions also have several window/menu/mouse type features. Although the language and syntax are S-like, MacAnova is not S or R.
We found the program started up quickly and had a fairly good menu system, which output visible code that we could copy and manipulate, or save and run later. It is almost similar to SPSS 4 in that regard, though better integrated into the system and lacking a separate output window. This is certainly worth a download. MacANOVA includes linear model and GLM routines.
SOFA Statistics
Listing updated: April 2018; source code updated 11/2017
SOFA Statistics (Statistics Open For All) is a graphical-interface statistical package with an emphasis on ease of use, discoverability, and clean reporting. It can connect directly to several database sources, or can use data brought in from spreadsheets. The usual statistical suspects are available, including one-way ANOVA, t-tests, signed ranks, chi-square, and R; nested tables can be produced with row and column percentages, totals, sd, mean, median, and sum.
SOFA Statistics is written in Python, using a wxPython widget toolkit. Statistics come via the Scipy stats module. Analysis and reporting can be automated using Python scripts, either exported from SOFA or written by hand.
Data importation is currently available for Mac users from Google spreadsheets and CSV files. Dynamic charts have been added, using html, SVG, and Javascript. This project was under rapid development for a while but seems to have slowed down.
Statistics101
Configurations: Java
Current Version: 4.3
Listing updated: 1/2017
Statistics101 is giftware to help teach probability and statistics the easy way—by simulation. “Gain deeper understanding of traditional statistics concepts and methods. Increase your awareness of the role of variability in probability and statistics. Learn and apply simple to very sophisticated statistical techniques without tables or complicated formulas.” Interprets and executes the simple “Resampling Stats” programming language. The original Resampling Stats language and computer program were developed by Dr. Julian Simon and Peter Bruce to teach statistics.
A somewhat steeper learning curve or tougher install
Salstat
Listing updated: 1/2/2017
Salstat dates back to the early 2000s and runs on Python; installing the free version on the Mac may require quite a bit of library-and-Python downloading, but a paid version makes everything easy. There is a reward to the work of installation, though, in a free program which makes highly presentable graphics, is relatively easy to use, provides a great deal of descriptive statistics with parametric and nonparametric tests, shows its own source code, does crosstabs, and “charts, imports CSV, HTML, XML, Excel, LibreOffice and SAS file formats, and can even scrape tables of data from web pages.” The last update was in 2014.
R (CRAN) / “R for Mac OS X” / R.App and R GUI
Current Version: 3; under active development
Listing updated 5/2013
This is an exceedingly flexible program, with a large number of libraries and built in routines, and the ability to run many S or S-Plus programs. R loads and runs quickly but has a steep learning curve.
R programs and algorithms are distributed by the Comprehensive R Archive Network (CRAN). A simple and somewhat frustrating graphic user interface is included for Mac users; R Commander can be installed using the built-in package installer, which can also install file import features (which aren't installed by default). R Commander is an X11 program, which means it uses an alien interface and has odd open/save dialogues, but if you get past that it offers menu driven commands not dissimilar from, say, SPSS, just a lot more awkward to use, and without an output or data window.
There are now numerous front ends for R, several of which are mentioned earlier on this page. R Commander is gnu software easily installed from Ubuntu and other distributions using the default software sources. (As of 4/26/18, at version 2.3).
R has a massive range of tests, PDF and PostScript output, a function to expand zip archives, and numerous other unexpected features. For much more information about R, including advantages, drawbacks, resources, and tips, see our incredibly outdated and largely irrelevant R statistics software for the Mac page.
R Studio
Current Version: 1.1x
Listing updated: 4/2018; program updated 3/2018
R Studio is commercial open-source software, designed for creating and managing R applications rather than, say, doing exploratory research or testing the odd hypothesis. With frills, it can get expensive, but without frills, it’s free. It’s a bit of a porker (500MB plus R itself at around 130MB) and requires a separate R download.
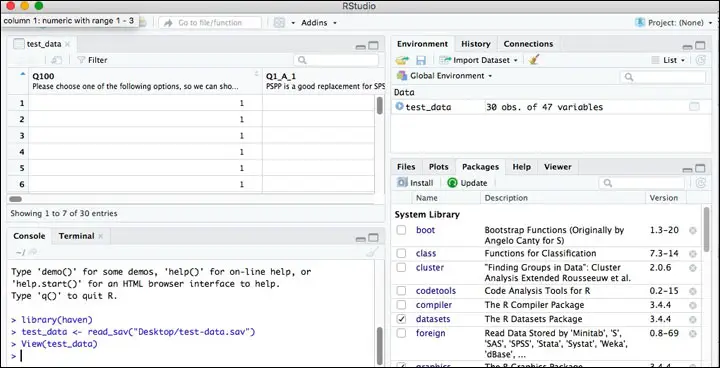
When you first load R Studio, it tells you to go back and install R. Once you've done that and restarted, it finds R easily enough, and presents you with an integrated development environment (IDE). If you try to do something, such as importing SPSS data, that isn’t possible without further downloads, it automatically connects to the Internet and installs whatever you need. Though you can manage your R installation from R Studio, it’s a tool for dealing directly with syntax, and for managing projects; it’s not a beginner’s tool (as, say, Jamovi can be). R Studio never claims to be anything but an IDE, with many options and good operating-system integration.
Specialty tools
gretl
The GNU Regression, Econometric and Time-Series Library (gretl) is a software package for econometric analysis. The package includes a shared library, a command-line client program, and a graphical client built using GTK+. It is available via apt on most Ubuntu installations.
GMT - The Generic Mapping Tools
Current version: 5.43
Program updated: 1-1-18
Listing updated: 4-25-18
A collection of command-line tools that run on all Unix-like systems, including Mac OS X. See gmt.soest.hawaii.edu for details. Many of the main developers (including me) use Mac OS X. (Description by Paul Wessel)
Graphviz
![]() Configurations: PPC (older versions), 10.5+ (current)
Configurations: PPC (older versions), 10.5+ (current)
Current Version: 2.20.3
Listing updated: 7-7-13
Graphviz is the AT&T open source drawing package. Prepare for a steep learning curve but it may be worth it if you have graphs you do frequently; not what I'd suggest for the occasional one-off though.
gnuplot
![]() Current Version: 4.6.3
Current Version: 4.6.3
Listing updated: 7-7-13
Program updated: 4-18-13
gnuplot is open source scientific plotting software. It is available online from many sources
OpenEpi
Current Version: 2.2.1
Last update: 4-6-2013
Listing updated: 4-24-2018
![]() Kevin Sullivan’s open source OpenEpi software is available in four languages; unlike most software, it can be run from a web server or on a regular computer. The programs are written in Javascript and html and should be compatible with Macs and Linux and Windows machines. Test results are provided for each module to allow people to check reliability of their own setup. The software is set up for epidemiology and has numerous key statistics for that field, along with the usual means, medians, t-tests, ANOVAs, powers, etc.
Kevin Sullivan’s open source OpenEpi software is available in four languages; unlike most software, it can be run from a web server or on a regular computer. The programs are written in Javascript and html and should be compatible with Macs and Linux and Windows machines. Test results are provided for each module to allow people to check reliability of their own setup. The software is set up for epidemiology and has numerous key statistics for that field, along with the usual means, medians, t-tests, ANOVAs, powers, etc.
StatCrunch
StatCrunch is a freely available for web-based use, currently without advertisements, with a $5 per user fee for use on your own server, or $5/six months. It has the usual range of basic statistics, from t-tests to regression to ANOVA and nonparametric tests, with a wide range of graphs also available, and works from Excel or text files. StatCrunch will also store your data within reason. For those with low budgets or infrequent needs, StatCrunch's fairly easy to use interface and price are extremely attractive (it also makes sharing data easy).
About our test survey file
Our test survey file: The “survey file” has 1,000 cases, with 40 questions on a five-point scale, two irrelevant variables (screen width and height), and a couple of demographics (shown here as “job type” and “new or old hire”). We are planning to run the same tests on each package as time goes on.
Sponsored by Toolpack Consulting

Copyright © 2005-2024 Zatz LLC. All rights reserved. Created in 1996 by Dr. Joel West; maintained since 2005 by Dr. David Zatz. Contact us. Terms/Privacy. Books by the MacStats maintainer